Silver on Binance (XAGUSDT) trades the same way as gold: long, short, leverage, around the clock. But it moves more sharply. That is why the same leverage gets wiped out more often on silver, and why the liquidation heatmap is more useful here than almost anywhere else.
Let's go through what the silver map shows, where the leverage sits, how whales and the crowd are positioned right now, and one reading mistake that is easy to make. All numbers are from October 10.
What the silver liquidation heatmap shows

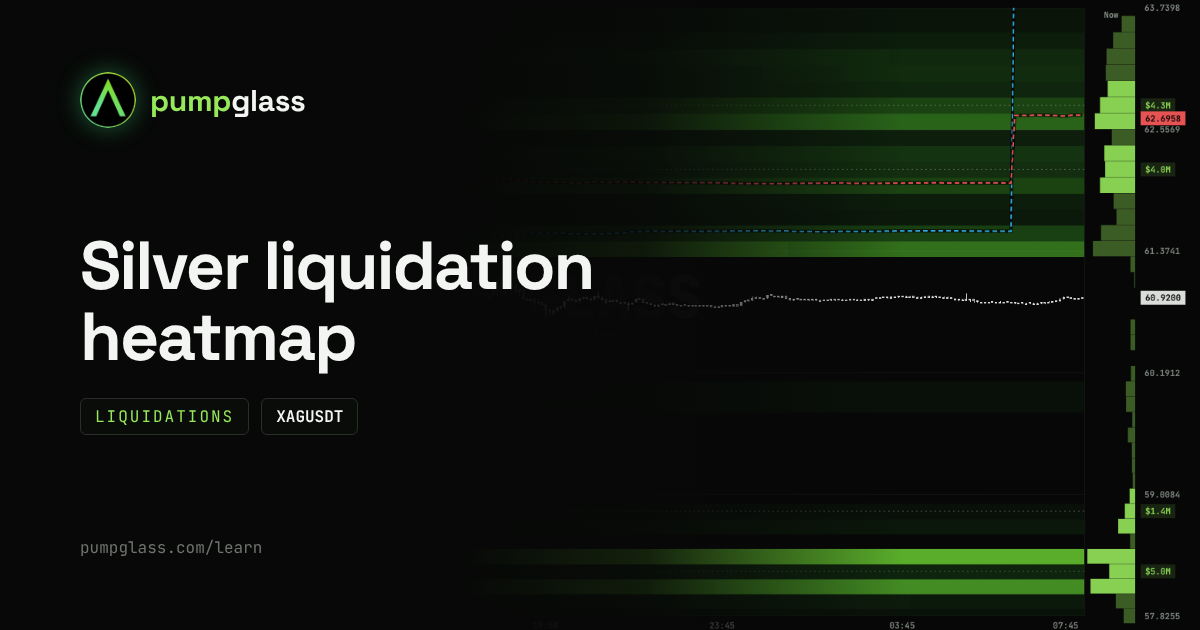
Example on October 2026 data. The numbers on the map change every minute, the current picture is on the XAGUSDT map.
How to read it, in short:
- bands above the price: shorts get liquidated here, and their liquidations are market buys;
- bands below the price: longs get liquidated here, and their liquidations are market sells;
- brightness: the brighter the band, the more money at that price;
- amounts on the right: how much sits at each level right now.
Why big players care about these levels and how a liquidation cascade works, we covered in detail with gold: Gold liquidation heatmap (XAUUSDT): how to read it. The mechanics on silver are the same. Below is what makes silver different.
Why silver is riskier than gold at the same leverage
Silver usually moves noticeably more sharply than gold. A 2 to 3% move in a day is normal for it, and sometimes it moves more.
What that means for leverage:
- at 50x, a position gets liquidated at roughly 2% against you. On gold that is a big move, on silver it is an ordinary day;
- liquidation bands on silver sit closer to the price in percent terms, and price reaches them more often;
- cascades are shorter in time: price can run through several bands in minutes.
The practical takeaway: if you move from gold to silver, lower your leverage. A position size that felt safe on gold can turn into a bet on a single sharp wick on silver.
October 10 breakdown: the top vs the bottom
Price is 60.92. Here is what the map shows:
Above the price:
- a band near 61.4 (+0.8%), very close;
- $4.0M of short liquidations near 62.2 (+2%);
- $4.3M of short liquidations near 62.8 (+3%).
Below the price:
- almost empty down to 58.85;
- $1.4M near 58.85 (-3.4%);
- $5.0M near 58.25 (-4.4%).
What follows from this. The single biggest band is below ($5.0M), but it is far away, at -4.4%. Above, each band is smaller, but they sit closer and tighter together: three levels within +3%. If price moves up, a short cascade has room to run, with each band pushing toward the next. Down, the first 3% are almost empty, there is nothing for price to catch on, and then $6.4M sits on two levels right away.
This is not a forecast of direction. It is the setup: above, the fuel is closer and stacked like a chain; below, it is further away but in one large block.
The crowd is 88% long, whales have turned

Here is how silver positions looked on October 10.
The crowd is almost all long. Among regular traders, 88% are long. That is a very one-sided position.
Whales turned around over the week. A week ago, only 20% of whales were long. Now it is 51%. Large traders added a lot of longs over the week, but they are still more cautious than the crowd.
By money it is even. 102 whales in longs hold $36.7M, 90 whales in shorts hold $36.0M.
Average entries:
- whales in longs entered at 64.61 on average. Price is 60.92, so their longs are down $2.2M, and they need +6.1% to break even;
- whales in shorts entered at 62.70 on average. Their shorts are up $1.1M, and they go into loss on a 2.9% rise.
Now put this together with the map. The whale average short entry (62.70) almost matches the top band of short liquidations ($4.3M near 62.8). If price reaches that zone, leveraged short liquidations fire at the same time as large shorts get back to break-even. We saw the same pattern on gold, and overlaps like this are worth marking in advance.
Order book: where real orders sit

The Order book tab shows limit orders that actually sit on the exchange. On October 10:
- above the price there are sell orders, the most in the 61.8 to 62.1 zone. That is right next to the $4.0M band of short liquidations near 62.2;
- below the price there are buy orders right at about 60.8, and a separate noticeable level near 59.9 (-1.7%).
How to read this together with the liquidation map. Above the price, the sell orders sit right in front of the short band. If price moves up, it first has to eat through those orders, and only then do liquidations start. If the sell orders disappear as price comes close, the way to the short band opens up.
How not to get it wrong: the jump in whale lines
Look at the right side of the liquidation map: on the morning of October 10, both dashed lines (whale average long and short entries) jumped up in a vertical line.
That does not mean whales opened huge positions at a new price in one minute. This happens when the group of large traders itself gets updated: some leave the group, others join, and the average price is recalculated from scratch.
The rule is simple: a vertical jump in the line is a change in the group, not a trade. Look at how the lines behave before and after the jump, and leave the jump itself out of your conclusions.
FAQ
Where can I see the silver liquidation heatmap?
On PumpGlass, at /heatmap/XAGUSDT. The liquidation heatmap, order book and whale average entries for silver are free and update once a minute.
Why do liquidations happen more often on silver than on gold?
Silver usually moves more sharply. At the same leverage, price needs less time to reach the liquidation level.
What does it mean when the crowd is 88% long?
Almost all regular traders are betting on a rise, and their liquidation levels pile up below the price. It is not a signal to short, but it shows which side of the market is overloaded.
Why does the whale average entry line suddenly jump?
Most often it is an update of the group of large traders, not a trade. The average price is recalculated for the new group.
How is the silver map different from the gold map?
They work the same way. The difference is the asset itself: silver moves more sharply, so liquidation bands sit closer to the price in percent terms, and cascades play out faster.
Is it free?
Yes. Liquidations, the order book and whale entry lines on the map are open to everyone.
PumpGlass shows market data. It is not financial advice.