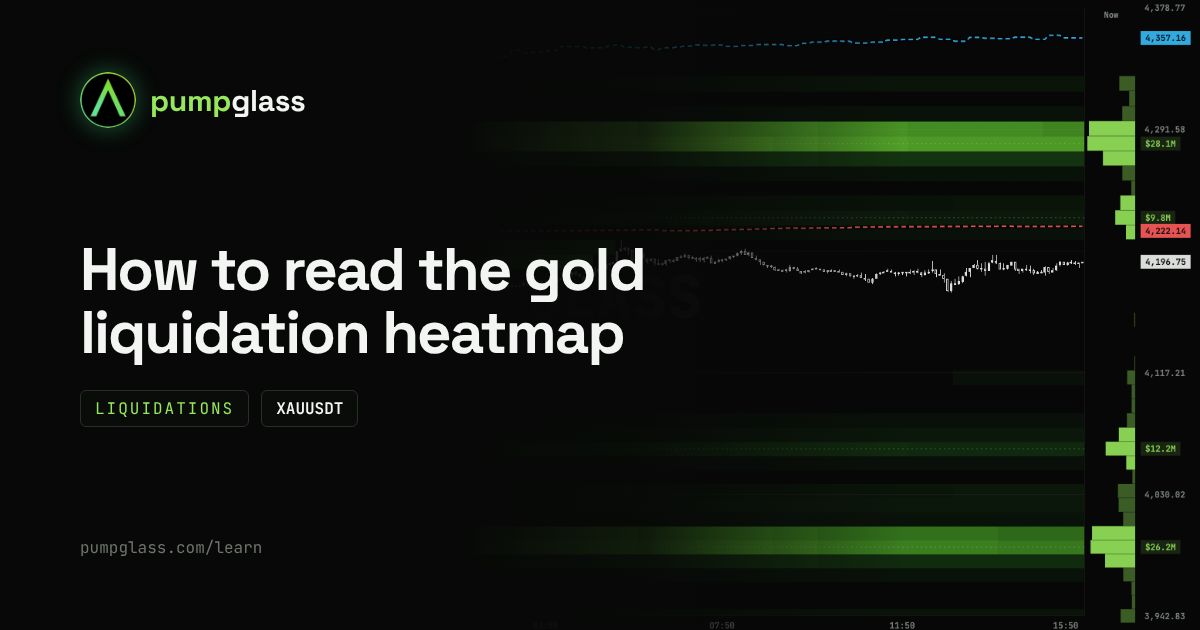
You opened the XAUUSDT map and see bright bands above and below the price. Each band shows a price where leveraged traders will get liquidated. The brighter the band, the more positions sit there.
But where the bands are is only half of it. The real question is why they matter and who benefits when price reaches them. Let's go through it with simple situations and a real gold map from October 9.
What XAUUSDT is
It is the Binance perpetual futures contract on gold. It trades like any crypto pair: long, short, leverage. The price follows gold.
Where there is leverage, there are liquidations. Thousands of traders open gold positions with leverage, and their liquidation prices cluster at certain levels. The map shows where.
What the liquidation heatmap shows

Example on October 2026 data. The numbers on the map change every minute, the current picture is on the XAUUSDT map.
- Bands above the price: this is where shorts get liquidated. Their liquidations are market buys.
- Bands below the price: this is where longs get liquidated. Their liquidations are market sells.
- Brightness: the brighter the band, the more money at that price. Faint bands barely matter.
- Bars and amounts on the right: how much sits at each price right now.
When price touches a band, the positions at that level get closed and the band fades. So the map shows not only where leverage sits, but also where it has already been wiped out.
The map updates once a minute. The price in the header is live from Binance.
Why big players care about liquidation levels
This is the part that usually goes unexplained, and without it the map is just a picture.
A liquidation is a forced market order. When a short gets liquidated, the exchange closes it with a market buy. The trader does not choose the price and cannot refuse. When a long gets liquidated, the exchange sells at market.
Now look at it from the side of a big player.
Situation 1: a big player needs to sell
A fund holds a large long in gold and wants to close it. If it starts selling a big size right now, it pushes the price down itself and sells for less than it wanted. It needs buyers, a lot of them at once.
Where do they come from? Above the price there is a bright band of short liquidations. If price gets pushed up there, the liquidations fire and the exchange starts buying at market for everyone who got wiped out. Those are the buyers. The big player sells its size straight into that wave of buying, at a good price and without slippage.
Situation 2: a big player needs to buy
The mirror case. A big player wants to build a large position cheaply. Below the price there is a bright band of long liquidations. If price gets pushed down there, the exchange starts selling at market for the liquidated traders. The big player absorbs those sells with its buys.
That is why bright bands are called liquidity. These are places where there will definitely be a lot of trades in one direction. For a big player, that is a chance to enter or exit with size.
Liquidation cascade: why price overshoots

Liquidations come in chains. Here is how it works with longs.
- Price drops to the first bright band.
- Longs at that level get liquidated, and the exchange sells them at market.
- Those sells push price lower, to the next band.
- More longs get liquidated there, more market sells.
- And so on, until the bands run out or a big buyer steps in.
That is how sharp candles happen, when price covers in a couple of minutes what usually takes a day. It is not news and it is not panic. It is a chain reaction of leverage.
Shorts work the same way, only upward: short liquidations are buys, and they push price higher, to the next band.
How to see it on the map: if bright bands sit tightly one after another, with no empty gaps, a cascade has room to run. If there are wide empty zones between bands, the chain is likely to stop sooner.
How to read the map in 3 steps
Find the nearest bright bands
Find the brightest band above the price and the brightest band below it. Check how far each one is in percent. That is the main thing the map gives you: where the nearest large clusters of leverage sit on each side.
Compare the top and the bottom
Let's take the gold map from October 9. Price is 4,196.
- Above: a small $9.8M band very close, near 4,228 (+0.8%). Behind it, the main $28.1M band near 4,280 (+2%).
- Below: $12.2M near 4,060 (-3%) and the main $26.2M band near 3,990 (-5%).
Leverage on both sides is almost equal: $28.1M against $26.2M. But the shorts sit two and a half times closer to the price. And the small band at +0.8% could become the first link of a chain: if it gets wiped out, the market buys head toward the main band at +2%.
This is not a forecast. It is the balance of forces: you can see that the fuel above the price is closer and the fuel below is further away, and which side would be under pressure first if a move starts.
Check where your stop is
A situation that happens to everyone. You bought gold and put your stop just below the nearest low. On the map, there is a bright liquidation band at exactly the same price. You put your stop where thousands of others put theirs.
Price wicks down, touches the band, a cascade starts and takes you out too. Half an hour later price is back, but you are no longer in the trade.
The takeaway is simple: if your stop sits inside a bright band, you are in the crowd that gets taken out first. Many traders put the stop beyond the band, not inside it, or cut the size so the stop can sit further away.
Order book heatmap: where real orders sit

The switch at the top opens the second map: the order book. Liquidations show where positions will close if price gets there. The order book shows limit orders that actually sit on the exchange.
The order book map draws history: where large orders stood and for how long. Each large order leaves a trace as a horizontal line.
On the October 9 map, you can see bright buy orders below the price near 4,165 and 4,145. Above, near 4,250, there is a sell order of about $7.9M.
How to read the lines:
- A clear, long line: a large order has been sitting at this price for a long time. Someone is ready to buy or sell a big size there and keeps the order in place. Such levels often act as support (buy orders below the price) or resistance (sell orders above the price).
- The line disappeared as price came close: the order was pulled at the last moment. It was there for show, so it is better not to rely on that level.
- Price came, the line vanished, price kept going: the order got filled. The level is broken.
- Short fragments: orders being placed and pulled. These lines mean very little.
Whale average entries on the map

The dashed lines on the map show the average price at which large traders hold their positions on XAUUSDT:
- blue: whale average long entry;
- red: whale average short entry.
On the October 9 map:
- whales in longs entered at 4,357 on average, price is 4,193. Their longs are down almost 4%;
- whales in shorts entered at 4,222 on average, which is above the price. Their shorts are in profit.
Why this helps. If price returns to 4,357, many whale longs get back to break-even, and there could be a lot of selling at that price. If price climbs above 4,222, whale shorts go into loss and have to decide whether to hold or close with a buy. These are two more levels where big money has its own interest.
Example: putting the three layers together
Here is the situation that makes it worth opening all three layers.
Gold is moving sideways. Below the price, 1 to 1.5% lower, you can see:
- a bright band of long liquidations;
- a clear, long line of buy orders in the order book at the same price;
- the whale average long entry just below it.
What it means. Three things meet at one price: crowd leverage gets wiped out there (market sells), a big buyer is waiting there (orders in the book), and whales defend their position there. For a big player, it is the perfect place to build size: the sells from liquidations run into ready buy orders.
From there you do not guess, you watch how price behaves if it gets there:
- Price arrives, the order book line holds, candles stop: the big buyer absorbed the sells. The cascade is stopped, and this is a defended zone.
- Price approaches and the order book line disappears: the buyer left before contact. There is no defense, and the cascade has an open road down to the next bands.
- Price cuts through the line: the order got filled. Look for the next bright band below, that is where the cascade could stop next.
That is the whole point of the map. It does not tell you where price will go. It shows you in advance where the important moment will be, and what to treat as a good sign or a bad one when that moment comes.
FAQ
Why do big players care about liquidation levels?
Liquidations are forced market orders. Short liquidations create a wave of buying that a big player can sell a large size into. Long liquidations create a wave of selling that a big player can buy from.
What is a liquidation cascade?
A chain in which some liquidations push price toward the next ones. Sells from liquidated longs drop price to the next band, new longs get liquidated there, and so on.
Does the heatmap show where gold will go?
No. It shows where leveraged positions and large orders sit. Price can pass by bright bands or reverse long before reaching them.
What is the difference between the Liquidations and Order book tabs?
Liquidations shows where positions will close if price gets there. Order book shows limit orders sitting on the exchange and how long they have been there.
What do the blue and red dashed lines mean?
Blue is the whale average long entry, red is the whale average short entry. They show whether large traders are in profit or in loss.
Is there a map like this for silver and other pairs?
Yes, for every Binance USDT-M futures pair, including silver, oil and tokenized stocks. For example, the silver heatmap.
Is it free?
Yes. Liquidations, the order book and whale entry lines on the map are open to everyone.
PumpGlass shows market data. It is not financial advice.