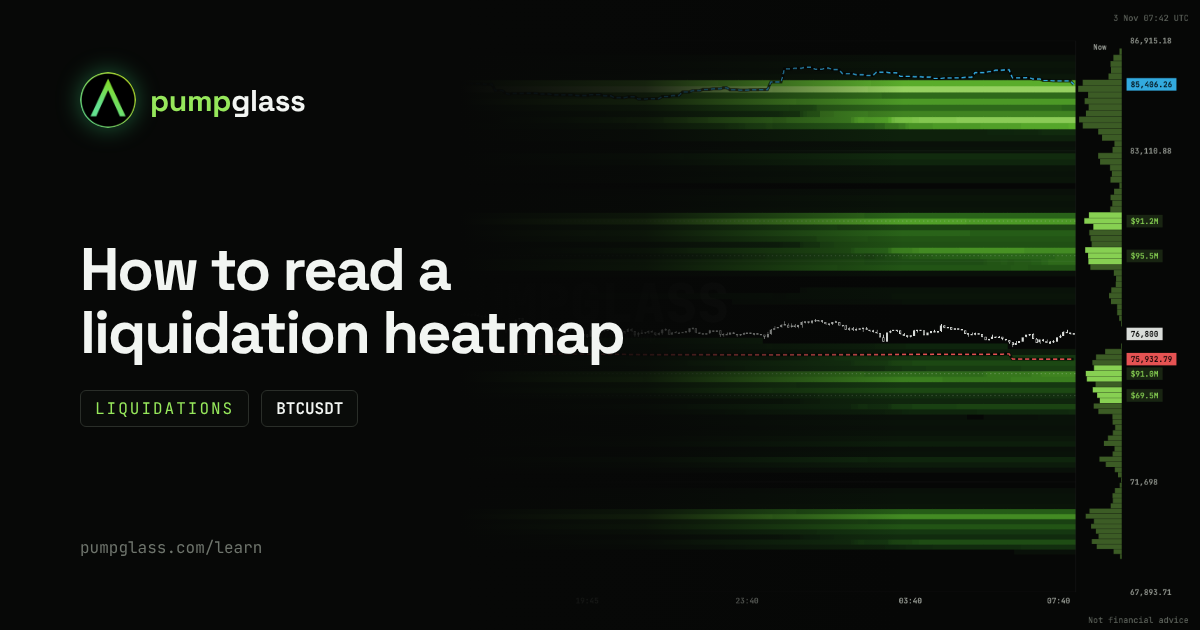
The liquidation heatmap in 30 seconds
A liquidation heatmap shows the prices where leveraged positions would be liquidated if the price got there.
- A bright band: many liquidations sit at that price.
- Above the price shorts get liquidated. A short liquidation is a market buy.
- Below the price longs get liquidated. A long liquidation is a market sell.
The one thing to remember: liquidations are fuel. When the price reaches a cluster, positions are closed by force, with market orders, and the move speeds up.
The map does not say where the price will go. It shows where other traders' leverage sits and where forced buying or selling would start. The levels are an estimate, not real orders: exchanges do not publish who gets liquidated where.
Liquidations and the order book: fuel and walls
The PumpGlass map has two tabs, and they show different things.
| Liquidations | Order book | |
|---|---|---|
| What it is | An estimate of where leveraged positions get liquidated | Real limit orders resting in the order book |
| How it works | Fires as market orders and speeds the move up | Meets the price and absorbs the move |
| Role | Fuel | A wall: support below, resistance above |
Put them together and you get the setup:
- Short liquidations above, no wall: the way up is open, and the move can speed up near the cluster.
- A big sell wall before the short cluster: the price has to eat the wall first. While the wall stands, the fuel may never be reached.
- A buy wall right under a long cluster: forced selling from longs runs into real buying. The drop can stop at the wall.
How to tell a real wall
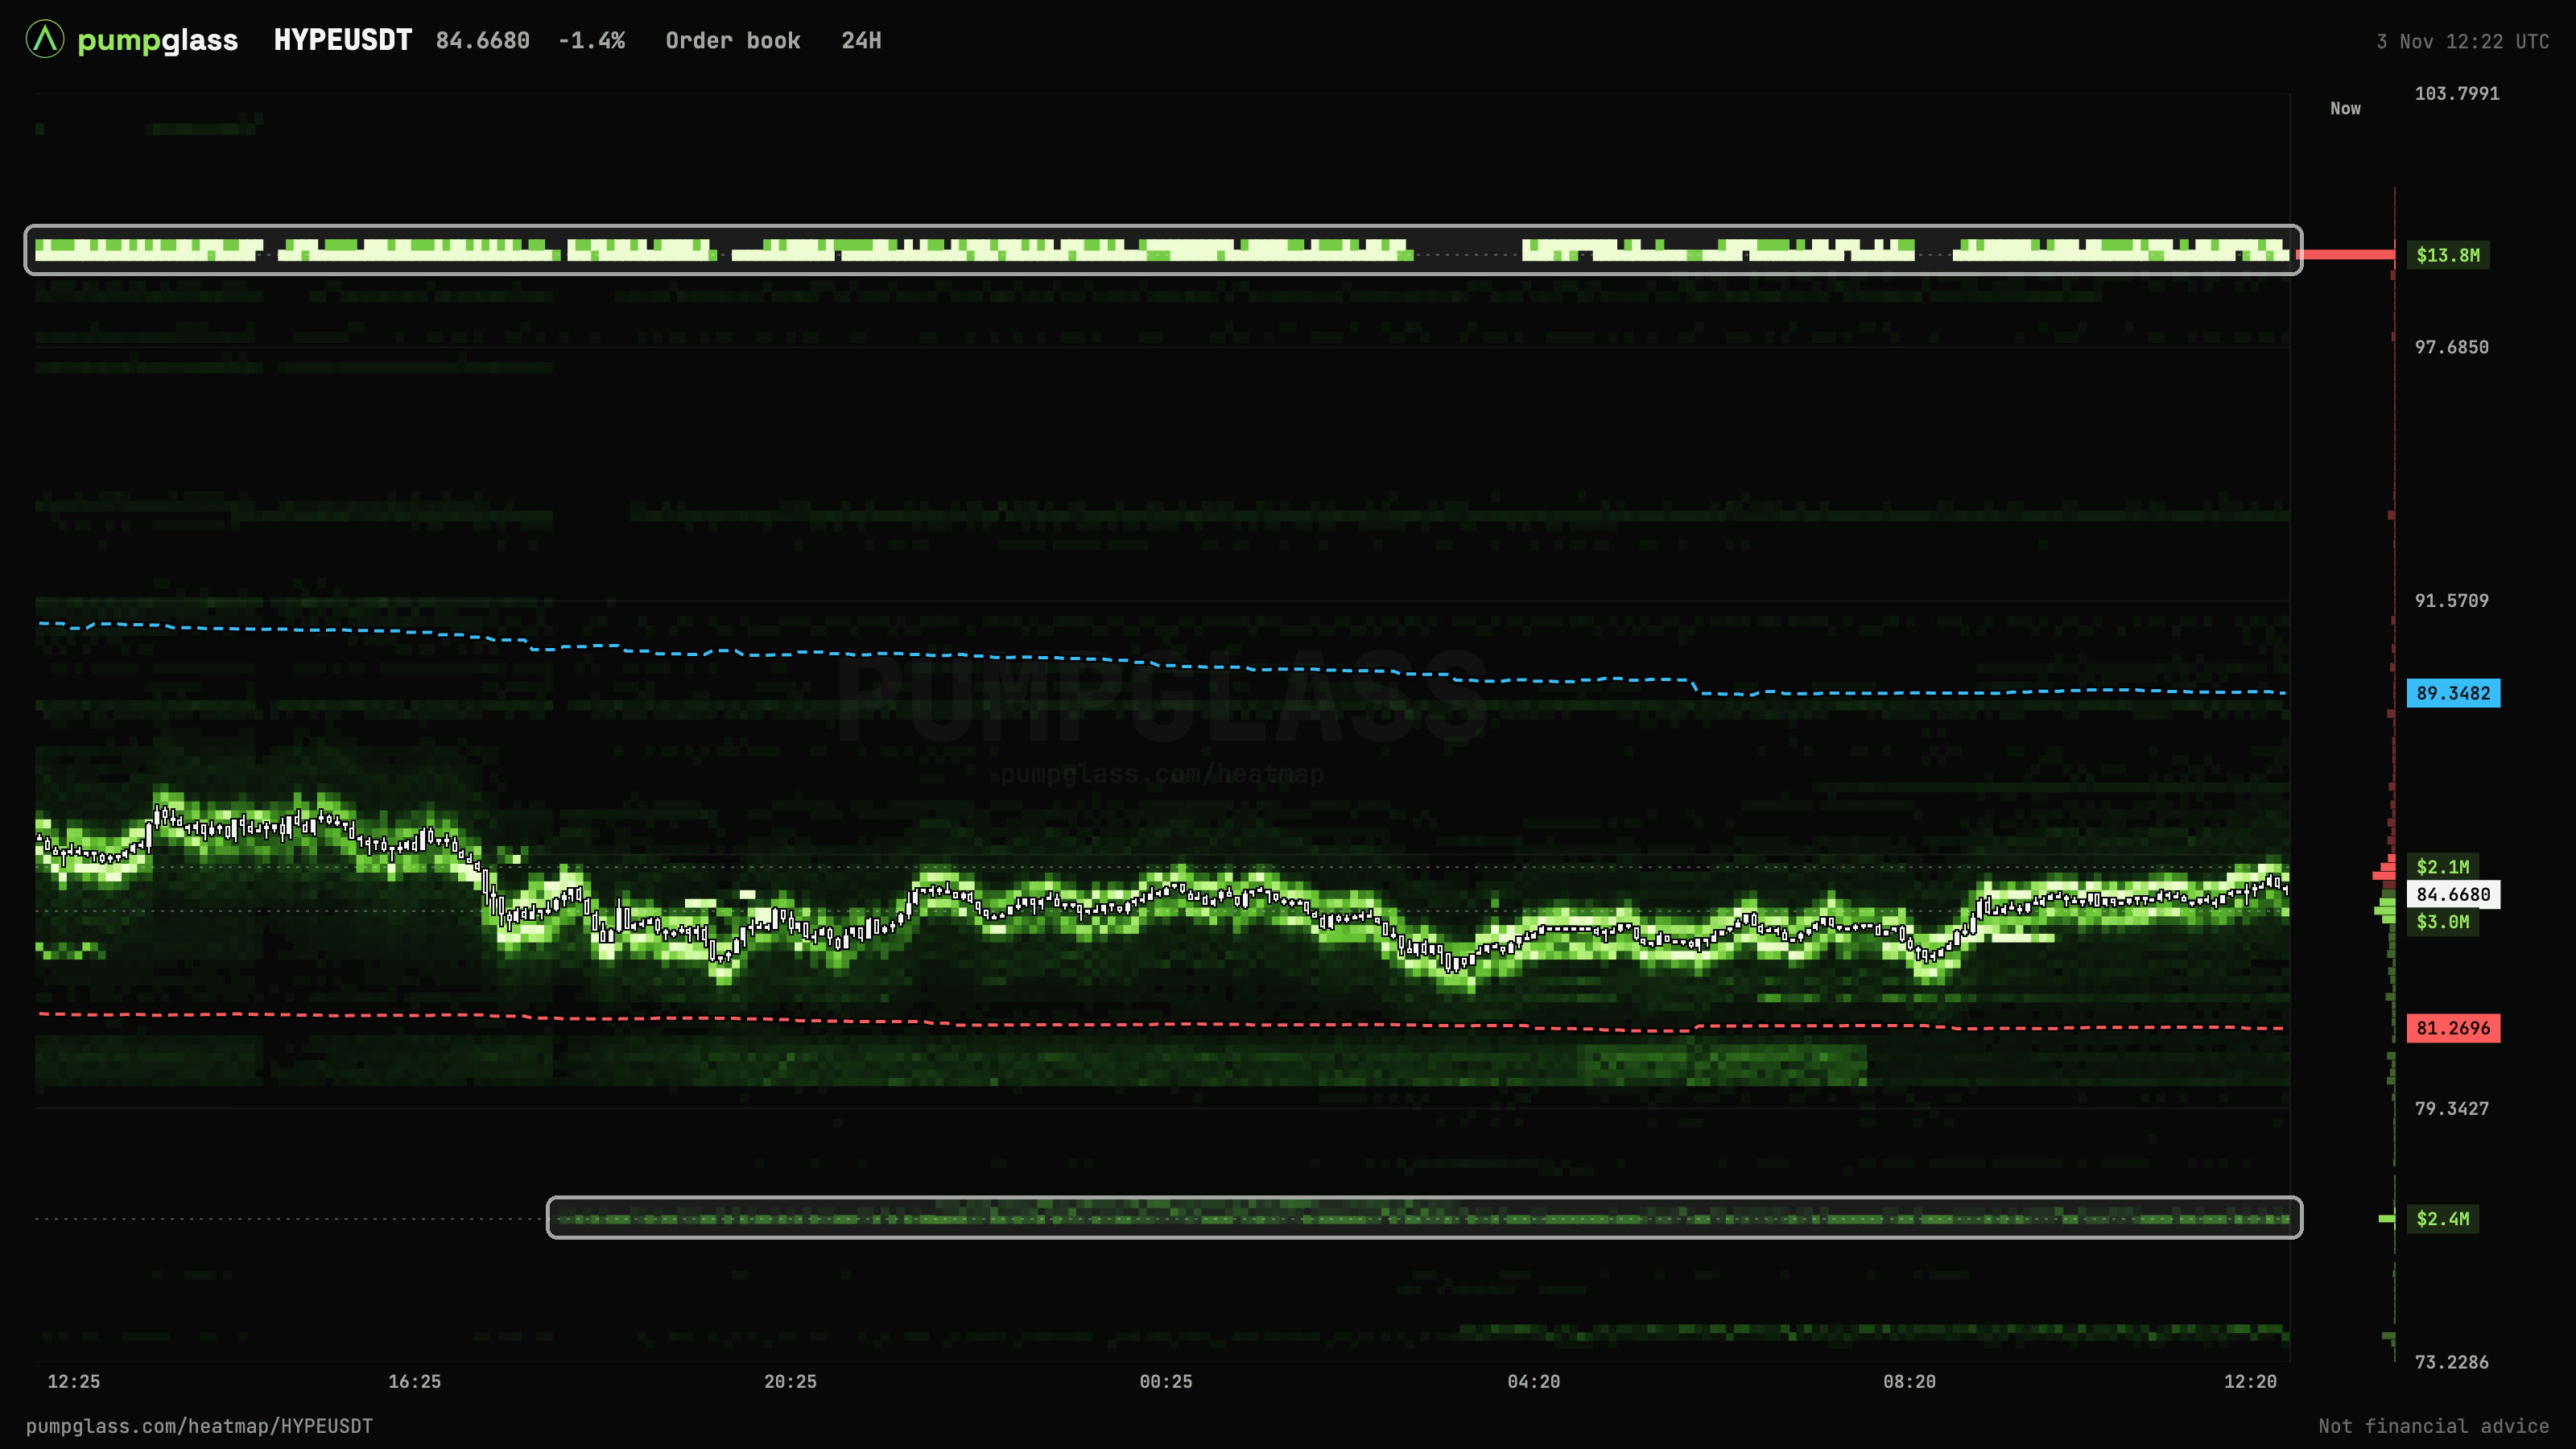
The HYPE order book shows the difference well:
- A wall is a horizontal band that stays at one price for hours. At the top, a $13.8M sell order sits at $100 and holds for the whole 24 hours, on a round number. Below, a $2.4M buy order sits at $76.70. It appeared in the evening and has not moved since.
- Bands that crawl along with the price are market maker orders. They move them after the price every minute, so they do not hold a level. That is not a wall, even if the band is bright.
The rule is simple: a wall does not move. If a band follows the shape of the candles, it is not a wall.
Walls can be pulled at any moment, and liquidations can disappear if traders close their positions themselves. So the setup is a picture of right now, not a promise.
How to read the map: a BTC example, step by step
Let's read a real BTC map from November 3, 2026. Price $76,800.
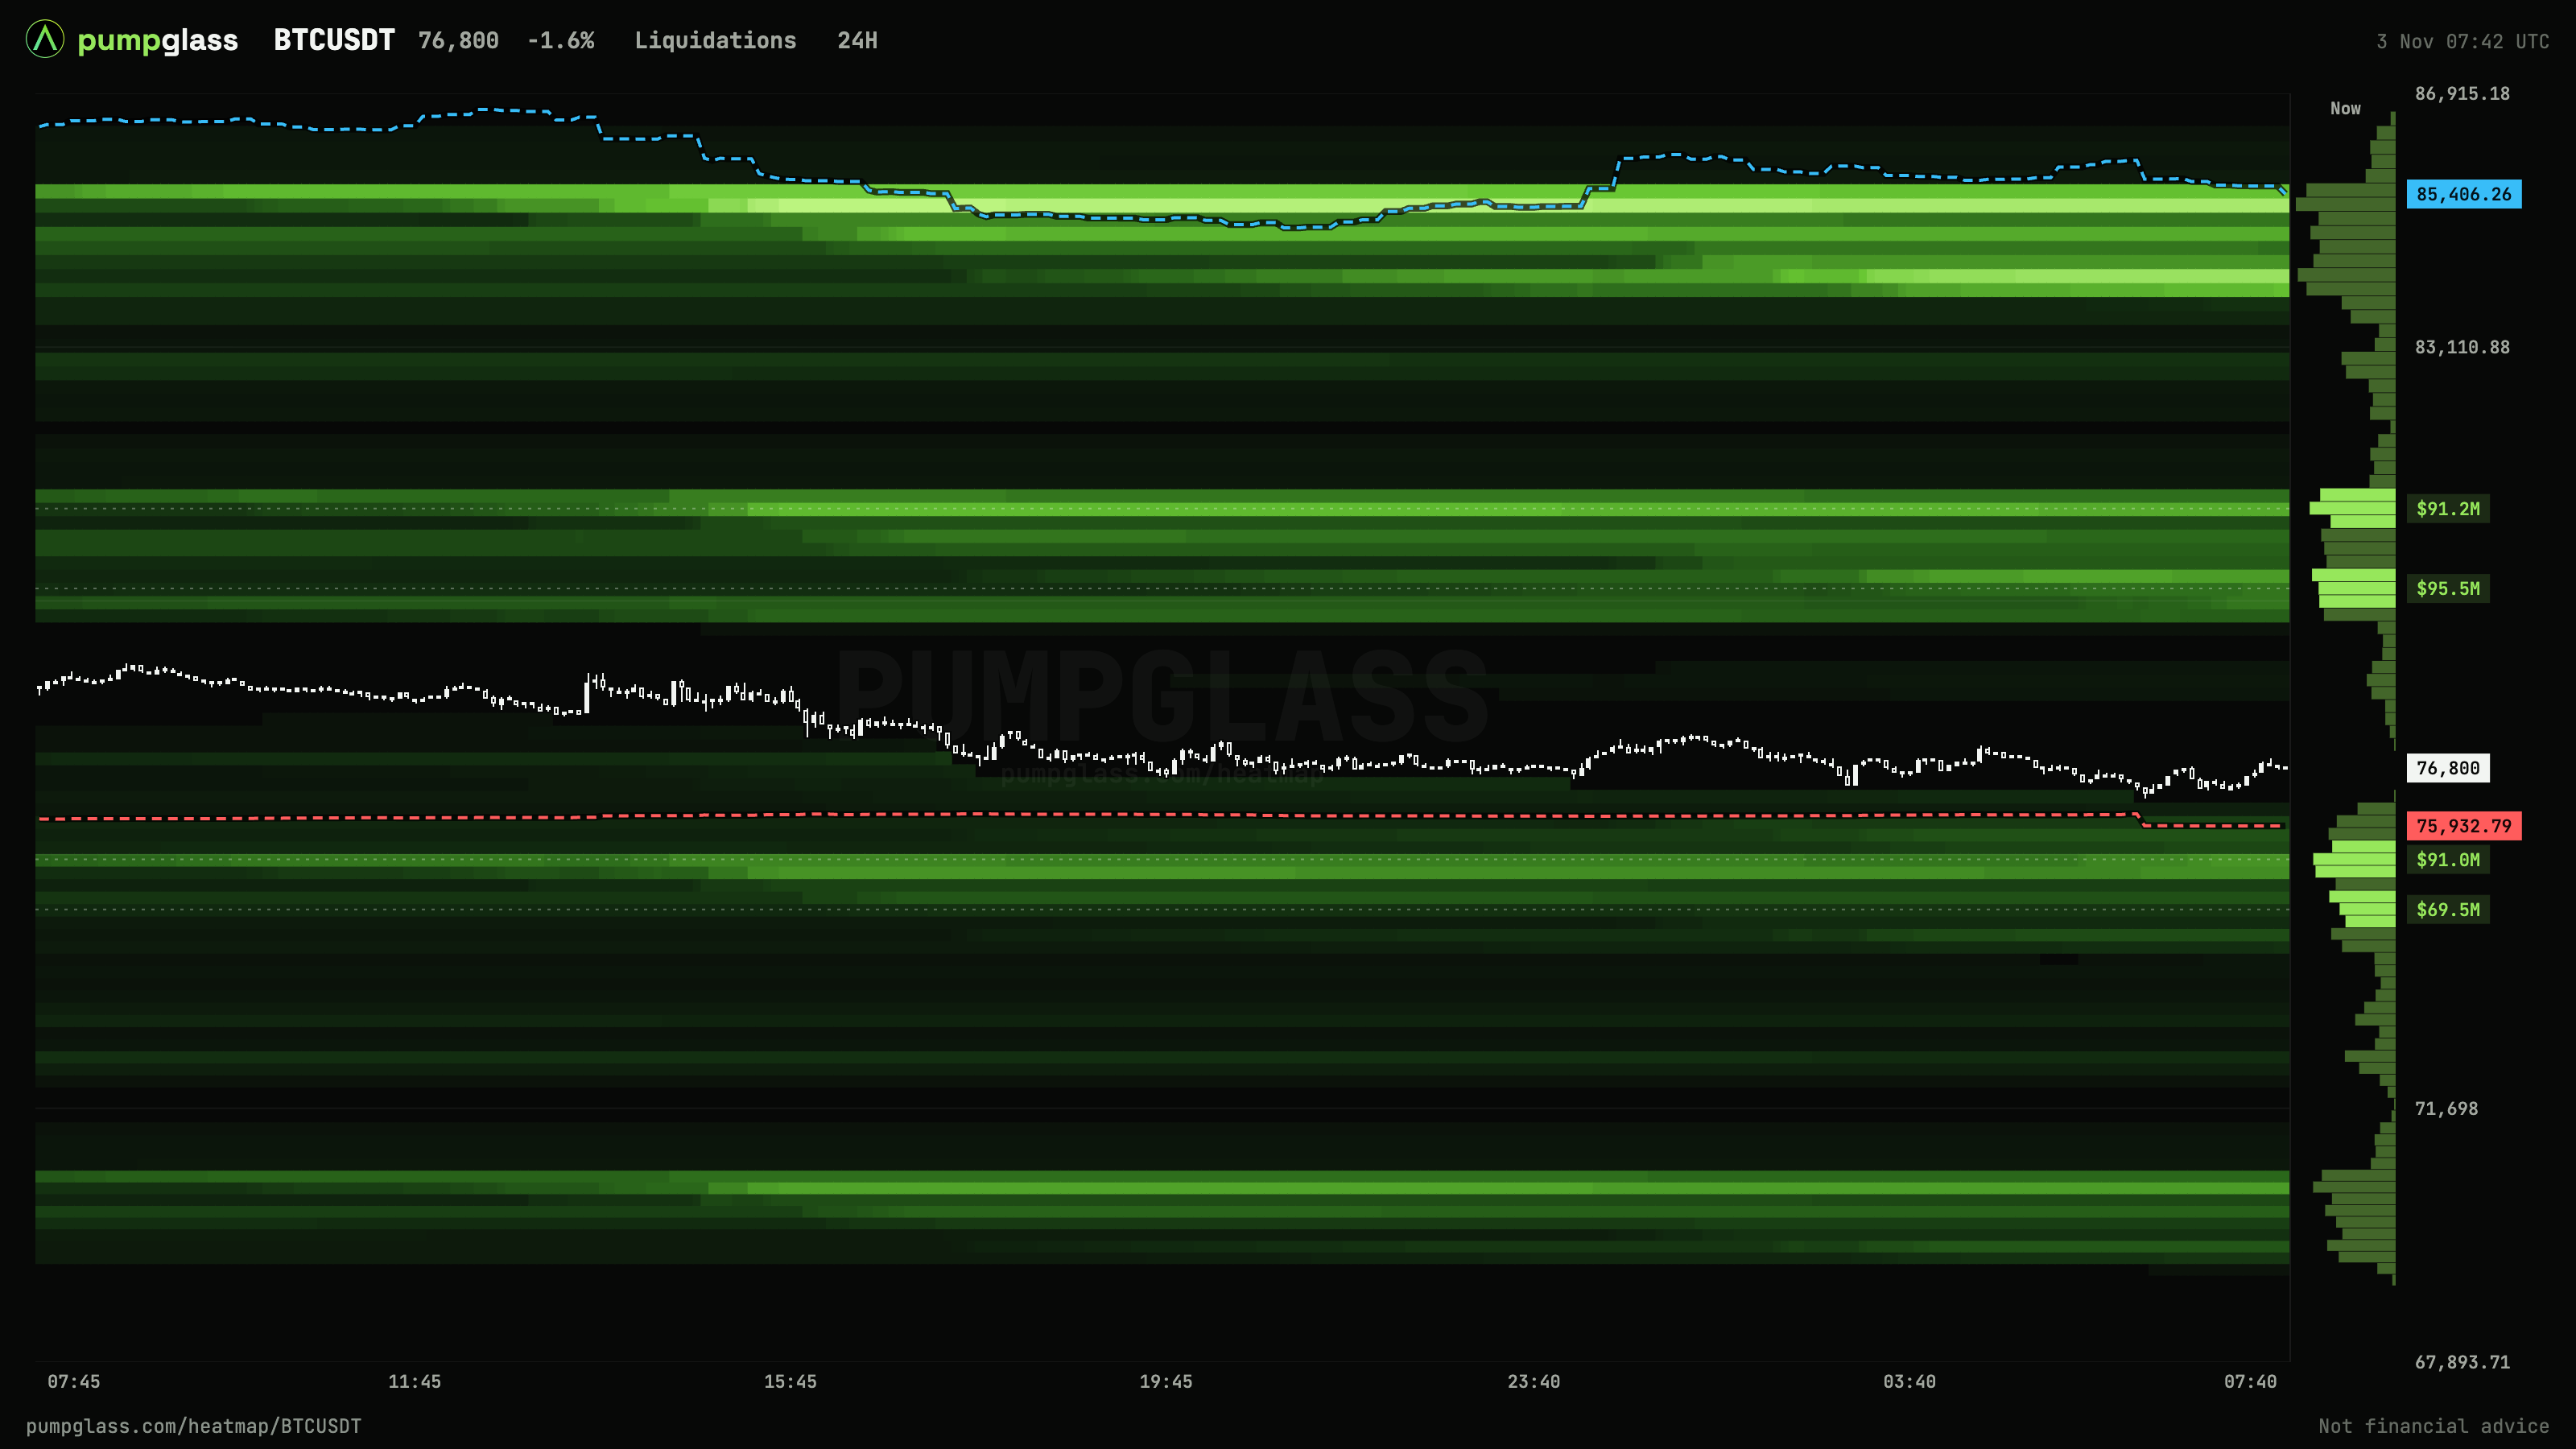
Step 1. Find the largest clusters on both sides
To the right of the map there is a histogram with dollar labels.
- Above the price: $95.5M at $79,200 (+3.1%) and $91.2M at $80,100 (+4.3%). These are shorts.
- Below the price: $91.0M at $75,300 (-2%) and $69.5M at $74,700 (-2.7%). These are longs.
Step 2. Compare distance and size
The sides are roughly even: about $187M above and $160M below. But the longs are closer: 2% away, the shorts 3%. A nearer cluster is easier to reach.
Step 3. Check where the whales are
The dotted lines are the whales' average entry prices: red for their longs, blue for their shorts. The whales' average long entry is $75,932, right above the long liquidation cluster.
The average entry is the whales' break-even. If the price drops below it, their longs go into loss. Then there are two options: whales add, which works as support, or they close, which adds selling. Nobody knows in advance which it will be. But at this price the behavior of big money changes, so it is worth watching.
Step 4. Put the picture together
- Up: the shorts are 3% away, and that is the fuel: $95M at $79,200 and $91M at $80,100.
- Down: the longs are 2% away, the whales' average entry $75,932 on the way, then $91M of long liquidations at $75,300.
Next, switch to the Order book tab and check whether a real wall that stays in place sits between the price and the clusters. If there is one, the price has to eat it first.
This is not a forecast, it is a map of the terrain: what meets the price in each direction. The decision and the risk are yours.
Example: how a cluster burns
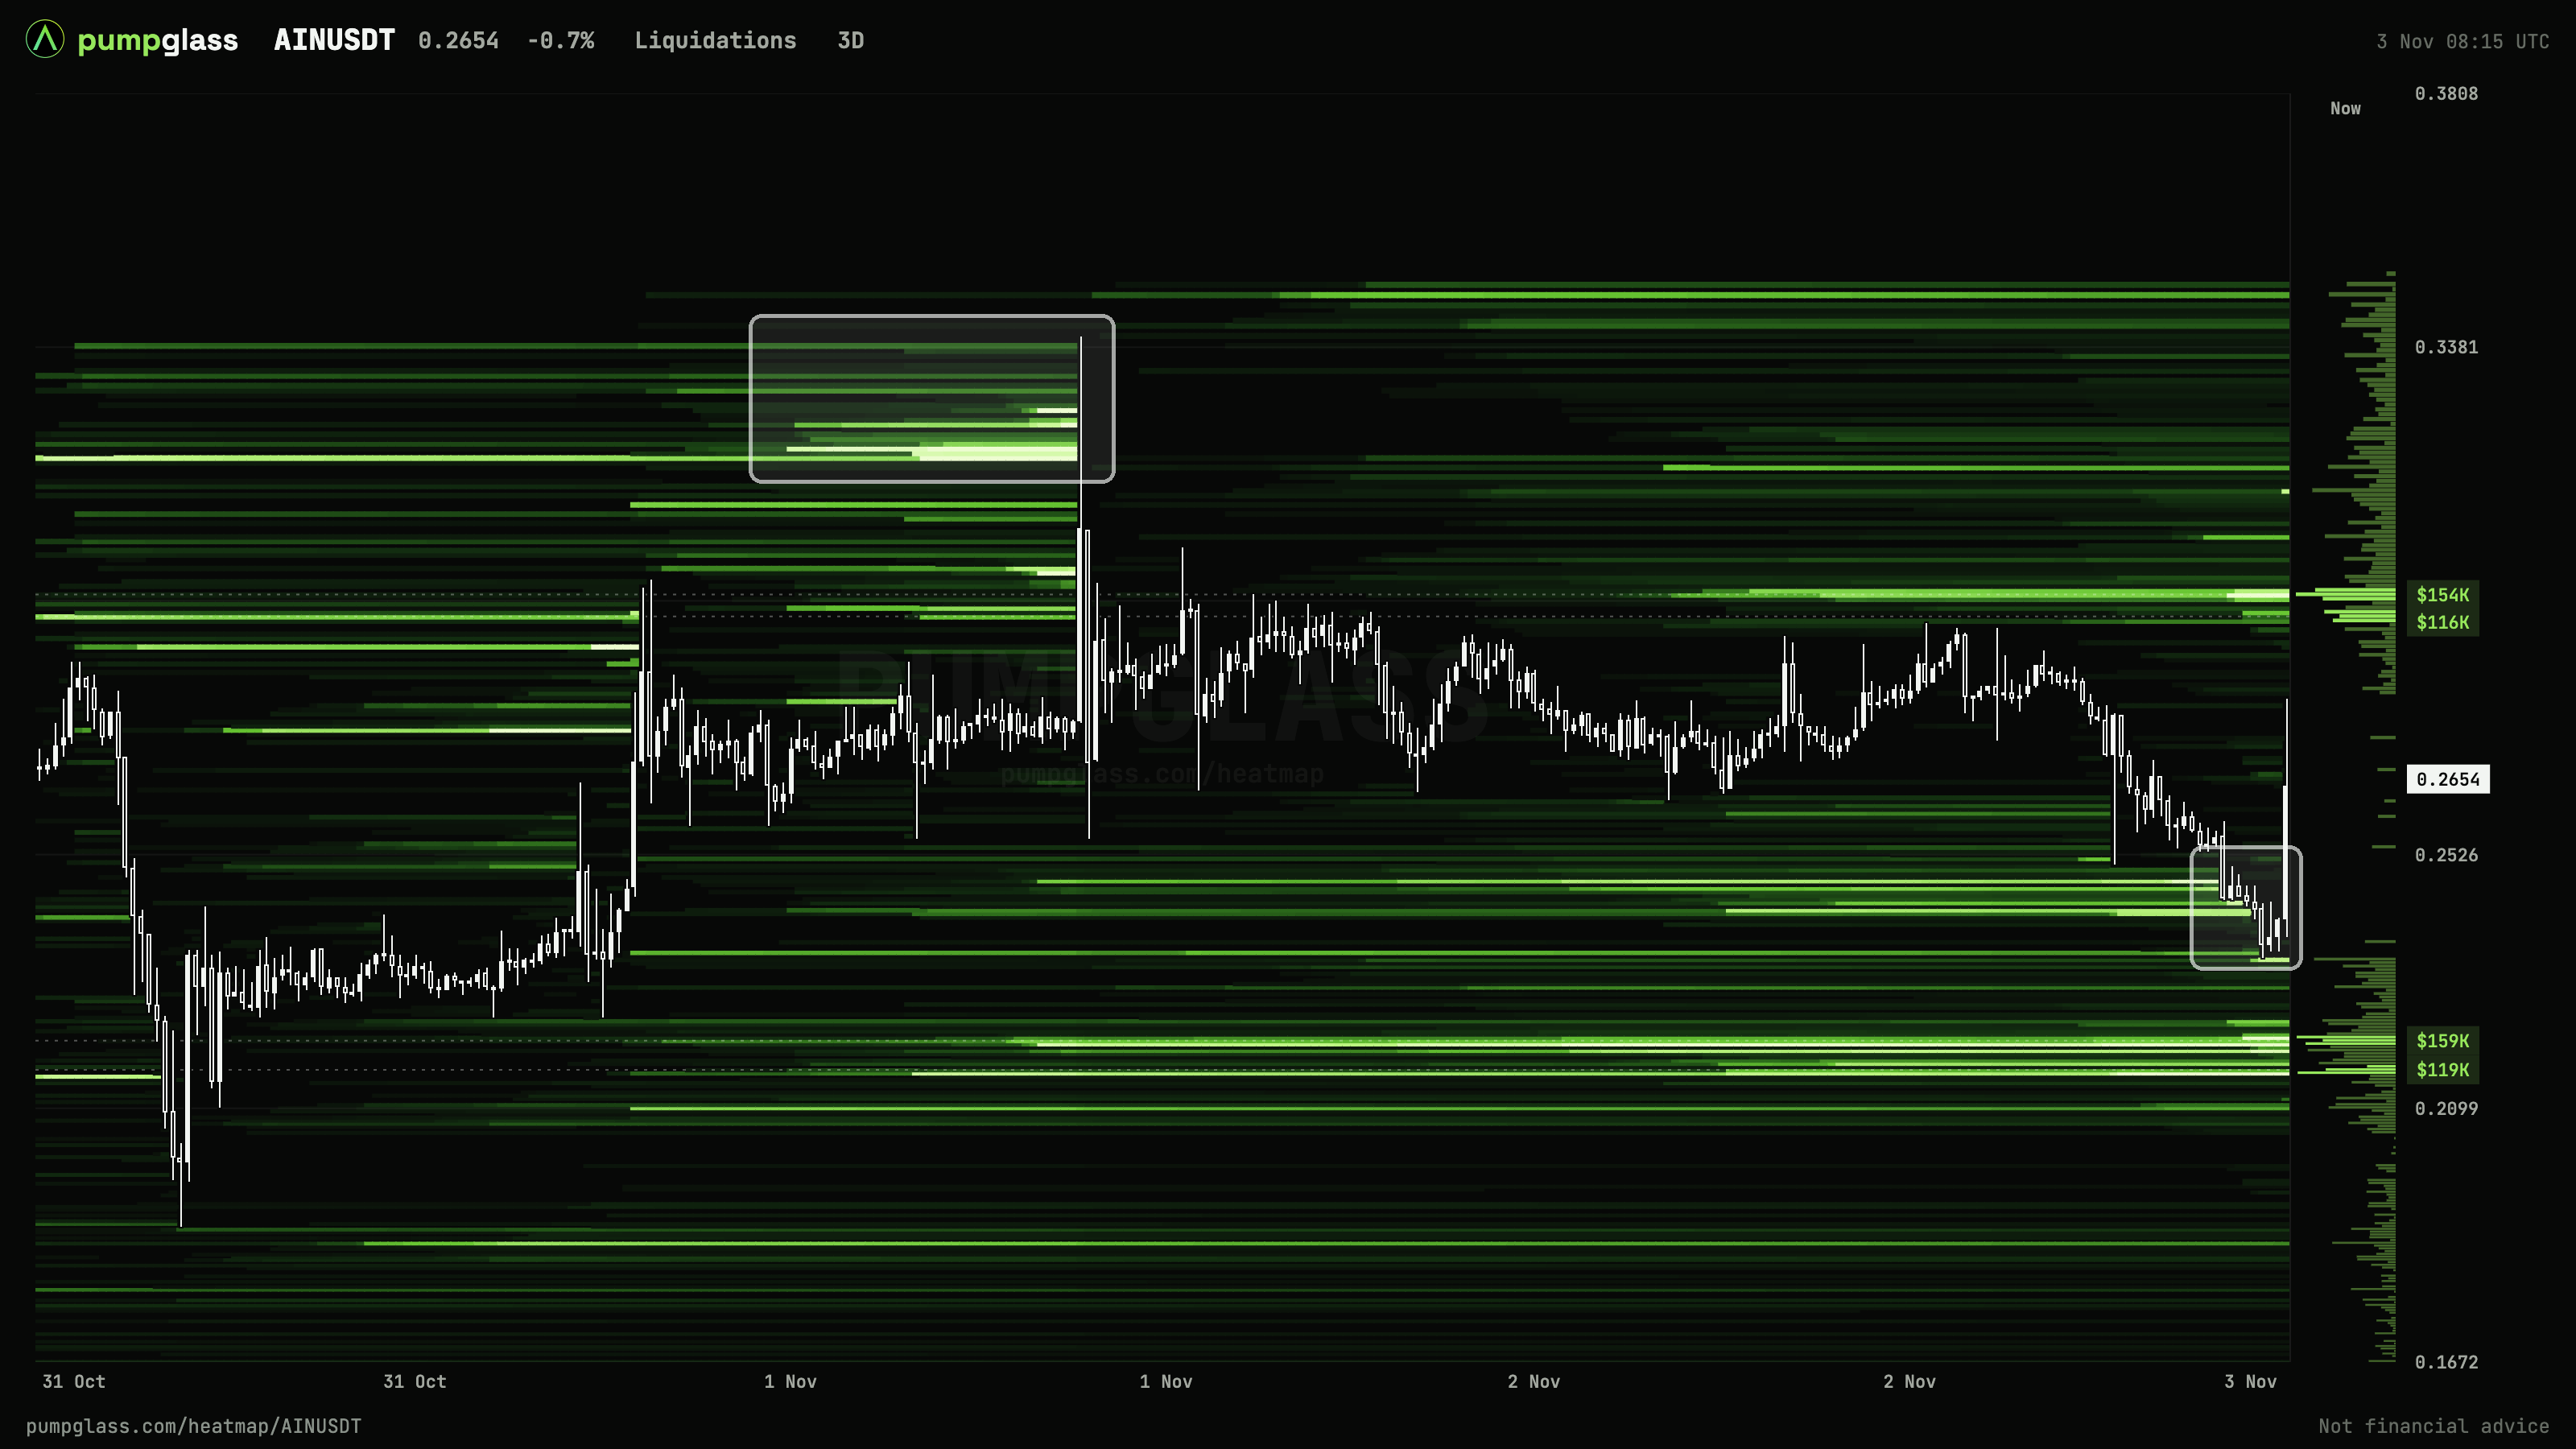
AIN is a good example, two moments are marked with frames.
Morning of November 1, a short cluster. From October 31, leveraged shorts piled up above the price, with the brightest bands around $0.32. The price stood near $0.275. On the morning of November 1 one candle shot a wick up to $0.339 and went through the whole cluster. You can see the bright bands end exactly at that wick: the shorts were liquidated, and their forced buying is what made the spike.
But then the price went back to $0.275. The fuel burned in minutes, the forced buying ran out, and there was nothing left to push the price higher.
November 3, a long cluster. The price was falling and reached the long bands around $0.25. The bands under the price end where the candles touched them: those longs were liquidated, and their selling sped the drop up. After that the price bounced to $0.265.
What follows from this:
- A band that ends is a level the price went through. There are no positions left there, and that fuel will not work a second time.
- Going through a cluster does not mean the move continues. Often it is the opposite: the fuel burns and the price turns. That is why the popular line "levels pull the price like a magnet" is misleading. A cluster shows where the move would speed up if the price got there. Whether it gets there and what happens after, the map does not say.
Map zoom: 12H, 24H, 3D, 7D
All levels are visible on any period. The buttons work as zoom: they change how much history fits on the screen. 24H is handy for the last hours, 7D shows when clusters appeared and what already burned during the week.
How to use the map in your own trade
- Put your stop beyond a cluster, not inside it. If there is a bright band under your long, the price only has to reach it to knock everyone out at once. A stop just past the band survives that flush.
- Set your target before a wall, not on it. A big wall in the order book can stop the price a little earlier.
- Don't stand with everyone else. If your liquidation falls into the same bright band as thousands of others, lower your leverage. You can calculate your liquidation price in the futures calculator.
- Watch the imbalance between sides. If there is several times more above than below, a sharp move up will be fast. That is not a reason to enter, but it is a reason not to hold a short with high leverage.
Common mistakes
- "The price goes to the brightest band". No. A band shows where the move would speed up if the price got there.
- Mixing up liquidations and the order book. Liquidations are fuel, walls are resistance and support. Check both tabs.
- Treating a burned level as live. If a band has ended, there is no fuel left there.
- Expecting the numbers to match other services exactly. It is an estimate, and everyone has their own assumptions. What matters is the shape of the map and the size of clusters compared to their neighbors.
FAQ
What is a liquidation heatmap in simple words?
A map of prices where leveraged positions would be liquidated. Bright bands show where there are many of them. Above the price are short liquidations, below are longs.
Are the levels on the map exact?
No, they are an estimate. Exchanges do not publish real liquidation prices. What matters is where the clusters are and how big they are compared to their neighbors, not the exact number.
Why did a cluster disappear from the map?
The price went through that level and the positions there were liquidated. Bands also fade when traders close their positions themselves.
Does the price always go to a big cluster?
No. A cluster shows where the move would speed up if the price got there. See the AIN example above: the price went through a short cluster with a wick and came straight back down.
How is a liquidation heatmap different from the order book?
Liquidations are an estimate of where leveraged positions get liquidated, and they fire as market orders that speed the move up. The order book shows real limit orders, which meet the price and work as support and resistance.
Where can I see a liquidation heatmap for free?
On the PumpGlass liquidation heatmap: every Binance futures pair, including gold, oil and stocks. Free, no sign-up, updated every minute.
PumpGlass shows market data. It is not financial advice.