
Price does not move by itself. It is moved by those with big money. And almost always they get in before the move shows up on the chart.
PumpGlass shows where the biggest traders on Binance futures open longs and shorts and where they close them. Close to real time, for every coin, across all 700+ pairs, including gold, oil and stocks. You see not transfers between wallets and not guesses from a chart, but the positions themselves: who got in, on which side, how big and at what price.
What you see that the chart does not show
Candles only show the result: price went up or down. They do not tell you who is behind the move. A whale tracker shows exactly that:
- position opens: whales added longs or shorts, and how big that is for this coin;
- position exits: whales cut longs or shorts, taking profit or leaving the market;
- whale average entry: the average price of their positions and whether they are in profit or at a loss;
- whales vs the crowd: where the biggest traders are looking and where everyone else is.
PumpGlass watches the positions of the biggest traders on every Binance pair non-stop and turns them into a clear picture: when whales got in, when they got out, how big it is for the coin and how it differs from the crowd. The whole market at once, on one screen, instead of checking coins one by one. Binance is not a random choice: it is the largest crypto futures exchange, where most of the leverage sits.

What it looks like before a pump
A picture we see again and again. A coin stands still or creeps up slowly, nothing special. Meanwhile, day after day, whales open longs, and the entries are many times larger than usual for this coin. The crowd does not notice. Then the move starts, and by the time the coin shows up among the top gainers, the big positions are already in place. That is what happened with QUSDT: whales built longs for several days, and the main move came on 17 October.
An unusually large long open on a quiet chart is exactly the moment to open the coin and take a close look.

What it looks like before a dump
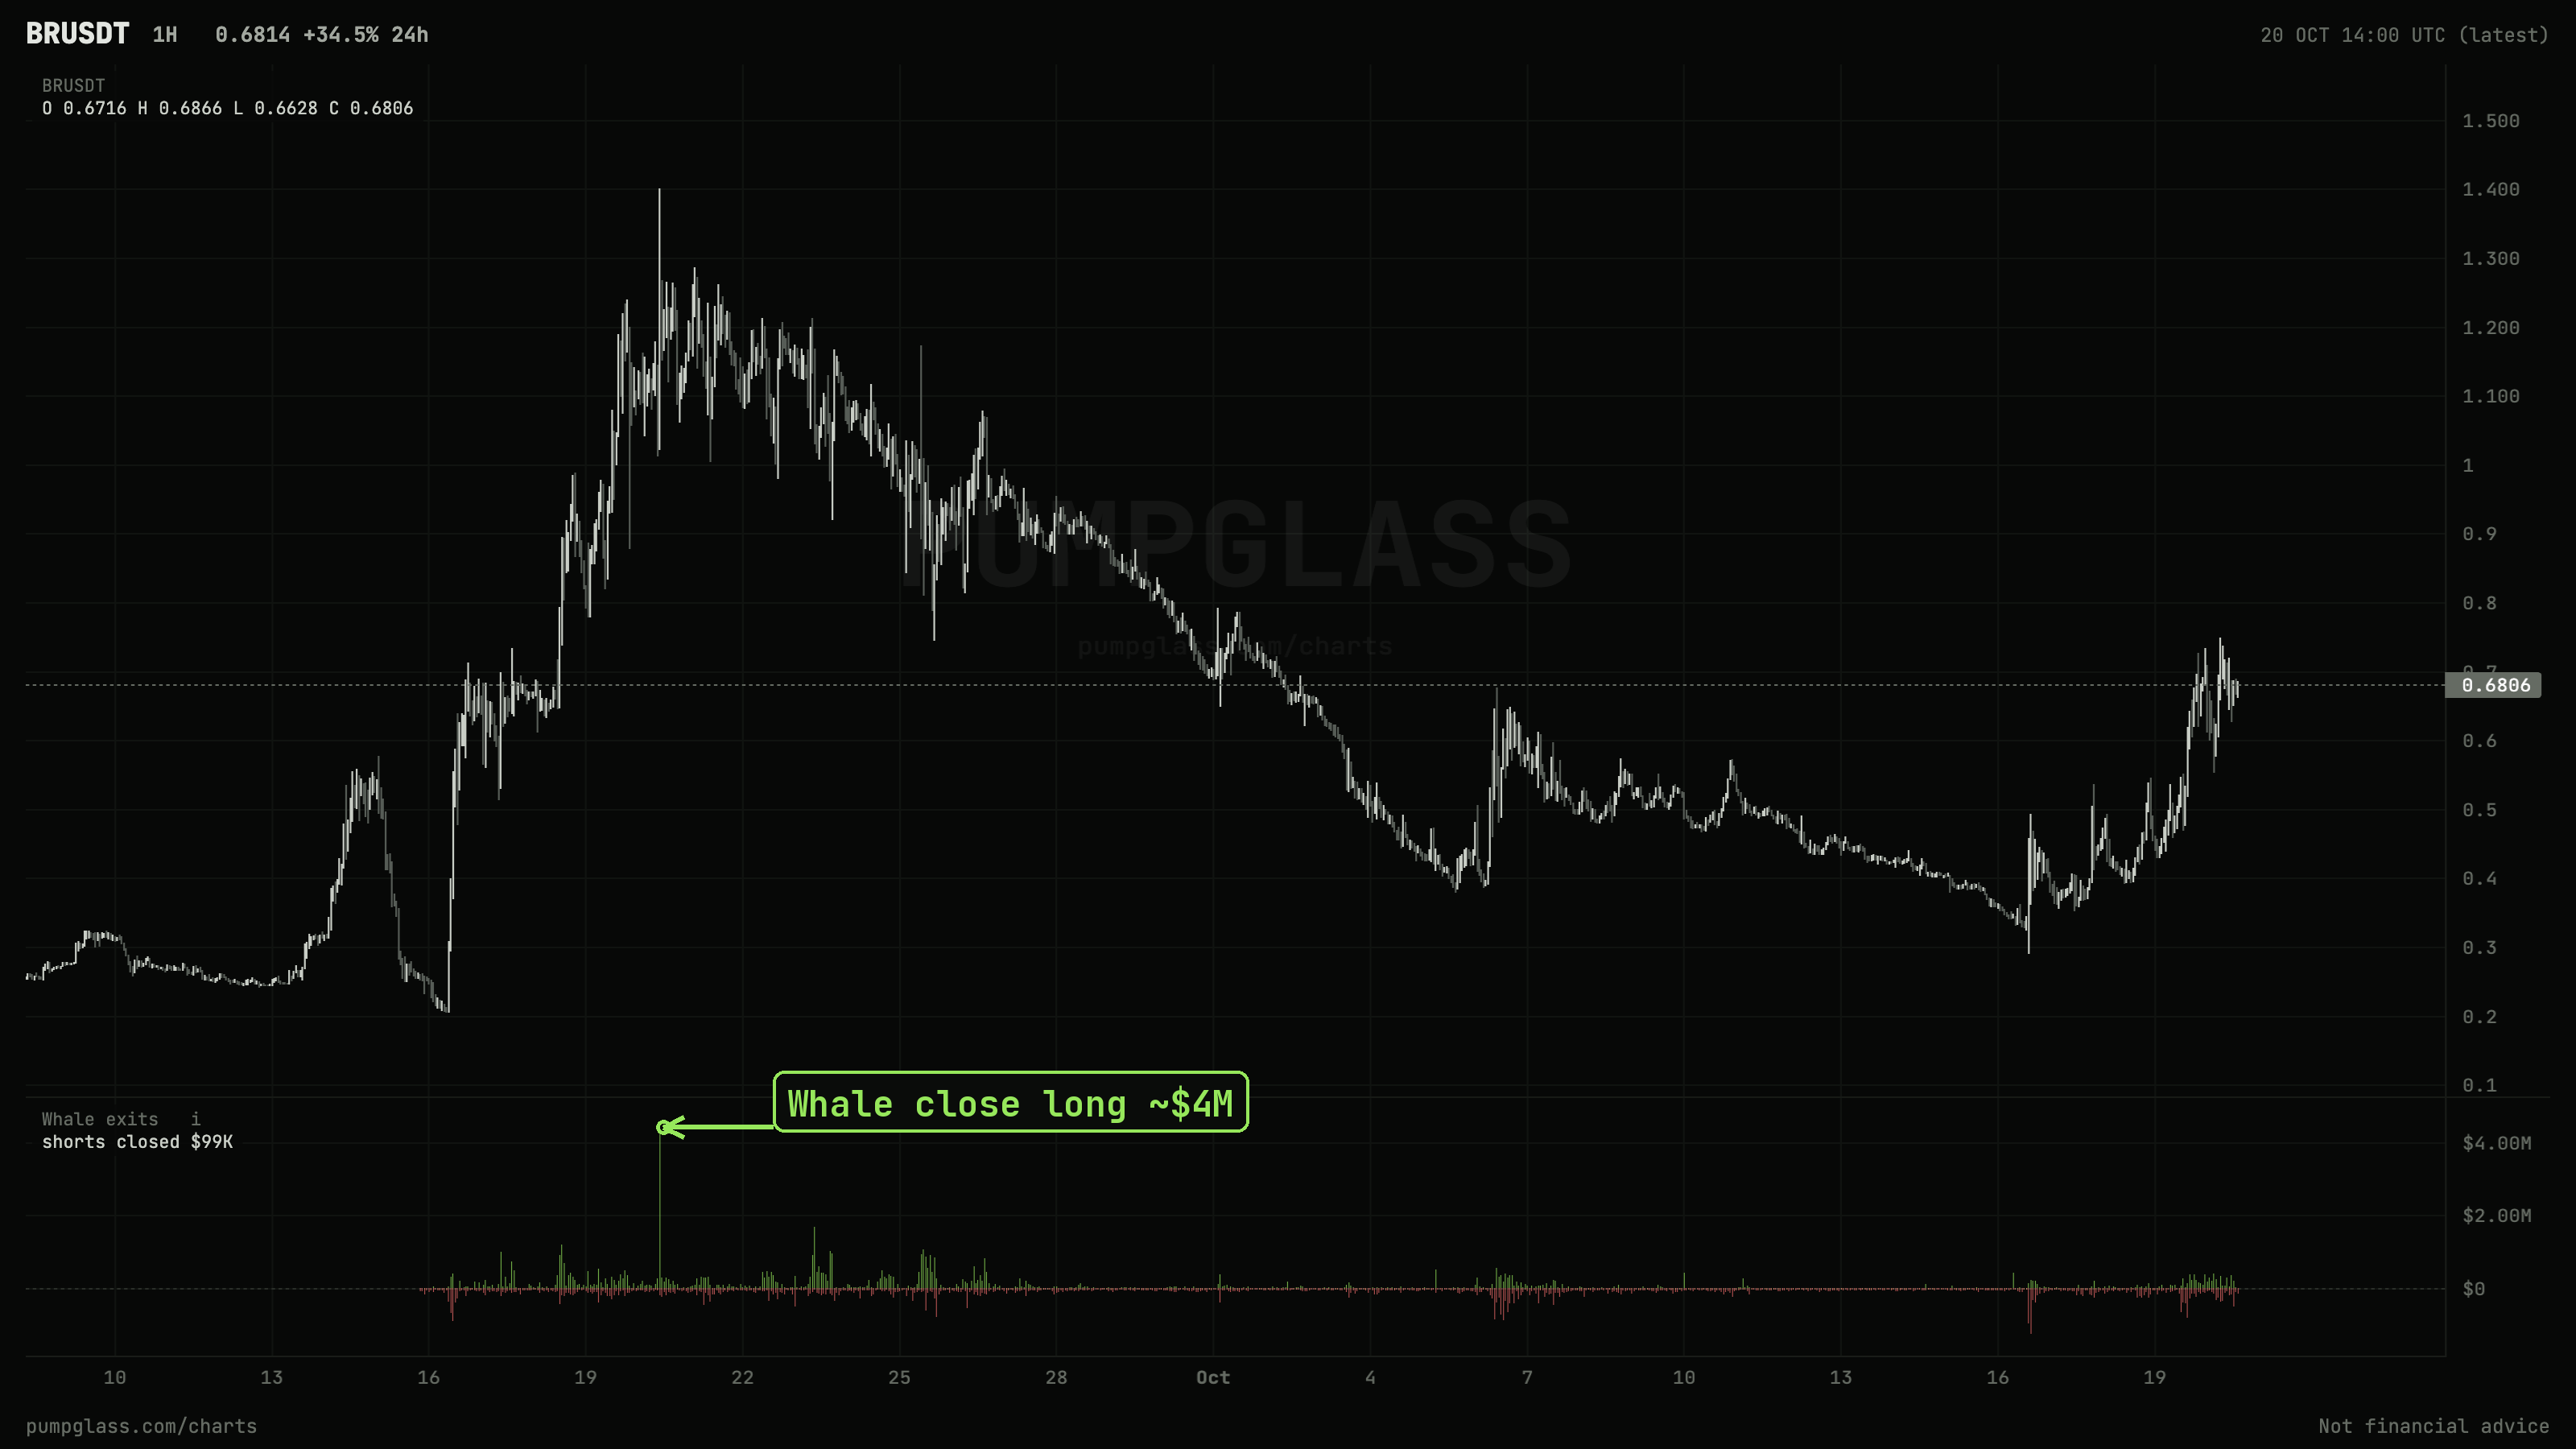
The opposite picture. Price is at the top, the crowd buys the highs. Whales start closing longs and take profit. Short opens often follow. From the outside it still looks like a rally, but big money is already leaving. On BRUSDT the largest whale long exit came right at the top, after which price lost more than 70%.
When price is rising while whales actively exit longs and switch to shorts, it is a reason to think twice before buying with the crowd.
Whales vs the crowd
The most interesting moments are when whales and the crowd stand on opposite sides. The crowd is heavily long while whales build shorts. Or the crowd panics into shorts while whales quietly buy. PumpGlass shows both sides next to each other, and the gap is visible at once.

Whale average entry on the chart and the liquidation heatmap
Whale average long and short entries are drawn on the coin chart and on the liquidation heatmap, next to the levels where leveraged positions burn and the real Binance order book. You see where big money breaks even, how that level moves and what stands nearby.

How to use it in five minutes a day
- Open the ranking and see where whales leaned hardest to one side.
- Open the coin and check whether it is a fresh entry or a position that has been there for a while.
- Look at the crowd: same side as whales or against them.
- If price has already moved far, check whether whales are closing positions.
- Open the liquidation heatmap and see where the whale average entry and the liquidation clusters are.
FAQ
Where does this data come from?
The base is the positions of the biggest traders on Binance. PumpGlass tracks them on every pair non-stop and works out on its own when whales open and close positions, how big an entry is for this coin and how whales differ from the crowd.
Why is this better than on-chain whale trackers?
On-chain trackers show transfers. A transfer to an exchange does not tell you whether someone opened a long, a short or nothing. And for most altcoins, futures volume is many times larger than spot: that is where leverage works, and that is where sharp moves are most often driven. So it matters more to see futures positions: side, size and entry price.
How fast does a whale entry show up?
Close to real time: a new entry appears on the chart within a few minutes.
Does price always go the whales' way after they enter?
Not always. Whales read the market better than the crowd, but sometimes they are wrong too. The tracker shows where big money stands, and the decision is yours.
Is there whale data for gold and stocks?
Yes. Gold XAUUSDT, silver, oil and stock futures on Binance are shown the same way as crypto.
PumpGlass shows market data and does not give trading advice.
PumpGlass shows market data. It is not financial advice.