
Price shows where the market went. Open interest shows whose money took it there: new positions or old ones being closed. These are different moves, and they behave differently. Below is how to see the difference on a chart and what to do with it.
What open interest is, in 30 seconds
Open interest (OI) is the number of futures contracts that are open right now and have not been closed.
Every contract has two sides, a buyer and a seller. If you open a 1 BTC long and someone opens a 1 BTC short against you, open interest grows by 1 BTC. If you later close your long and they close their short, OI drops by 1 BTC.
Three things to remember:
- OI rises when new positions are opened. New money and new leverage come into the market.
- OI falls when positions are closed: by hand, by a stop, or by liquidation.
- OI does not show direction. Every long has a short on the other side. Rising OI does not mean "everyone is buying".
The main trap: OI in dollars
Most sites show open interest in dollars. It is handy for scale, but it misleads on the one thing that matters.
OI in dollars is contracts multiplied by price. If the price rises 20% and nobody opens a single position, OI in dollars still rises 20%. It looks like money flowing in, while nobody opened anything.
An example from the chart below. The price almost doubled, while open interest in contracts fell 17%: positions were being closed. In dollars, OI grew by more than half over the same time, only because the price went up. If you watch dollars only, you see money coming in exactly when money was leaving.
The rule is simple: watch the change in OI in contracts. Dollars only tell you the size: a 10% rise in OI on BTC and on a small coin are very different amounts.
Four combinations of OI and price
Open interest is only read together with price. There are four cases:
| Open interest | Price | What happened |
|---|---|---|
| Rises | Rises | New positions are opened into the rise |
| Rises | Falls | New positions are opened into the fall |
| Falls | Rises | Positions are closed while the price rises |
| Falls | Falls | Positions are closed while the price falls |
Everyone knows this table. What helps is applying it to a live chart.
One chart, read step by step
Here is one day of AKE: price on top, open interest in contracts in the middle, liquidations at the bottom.
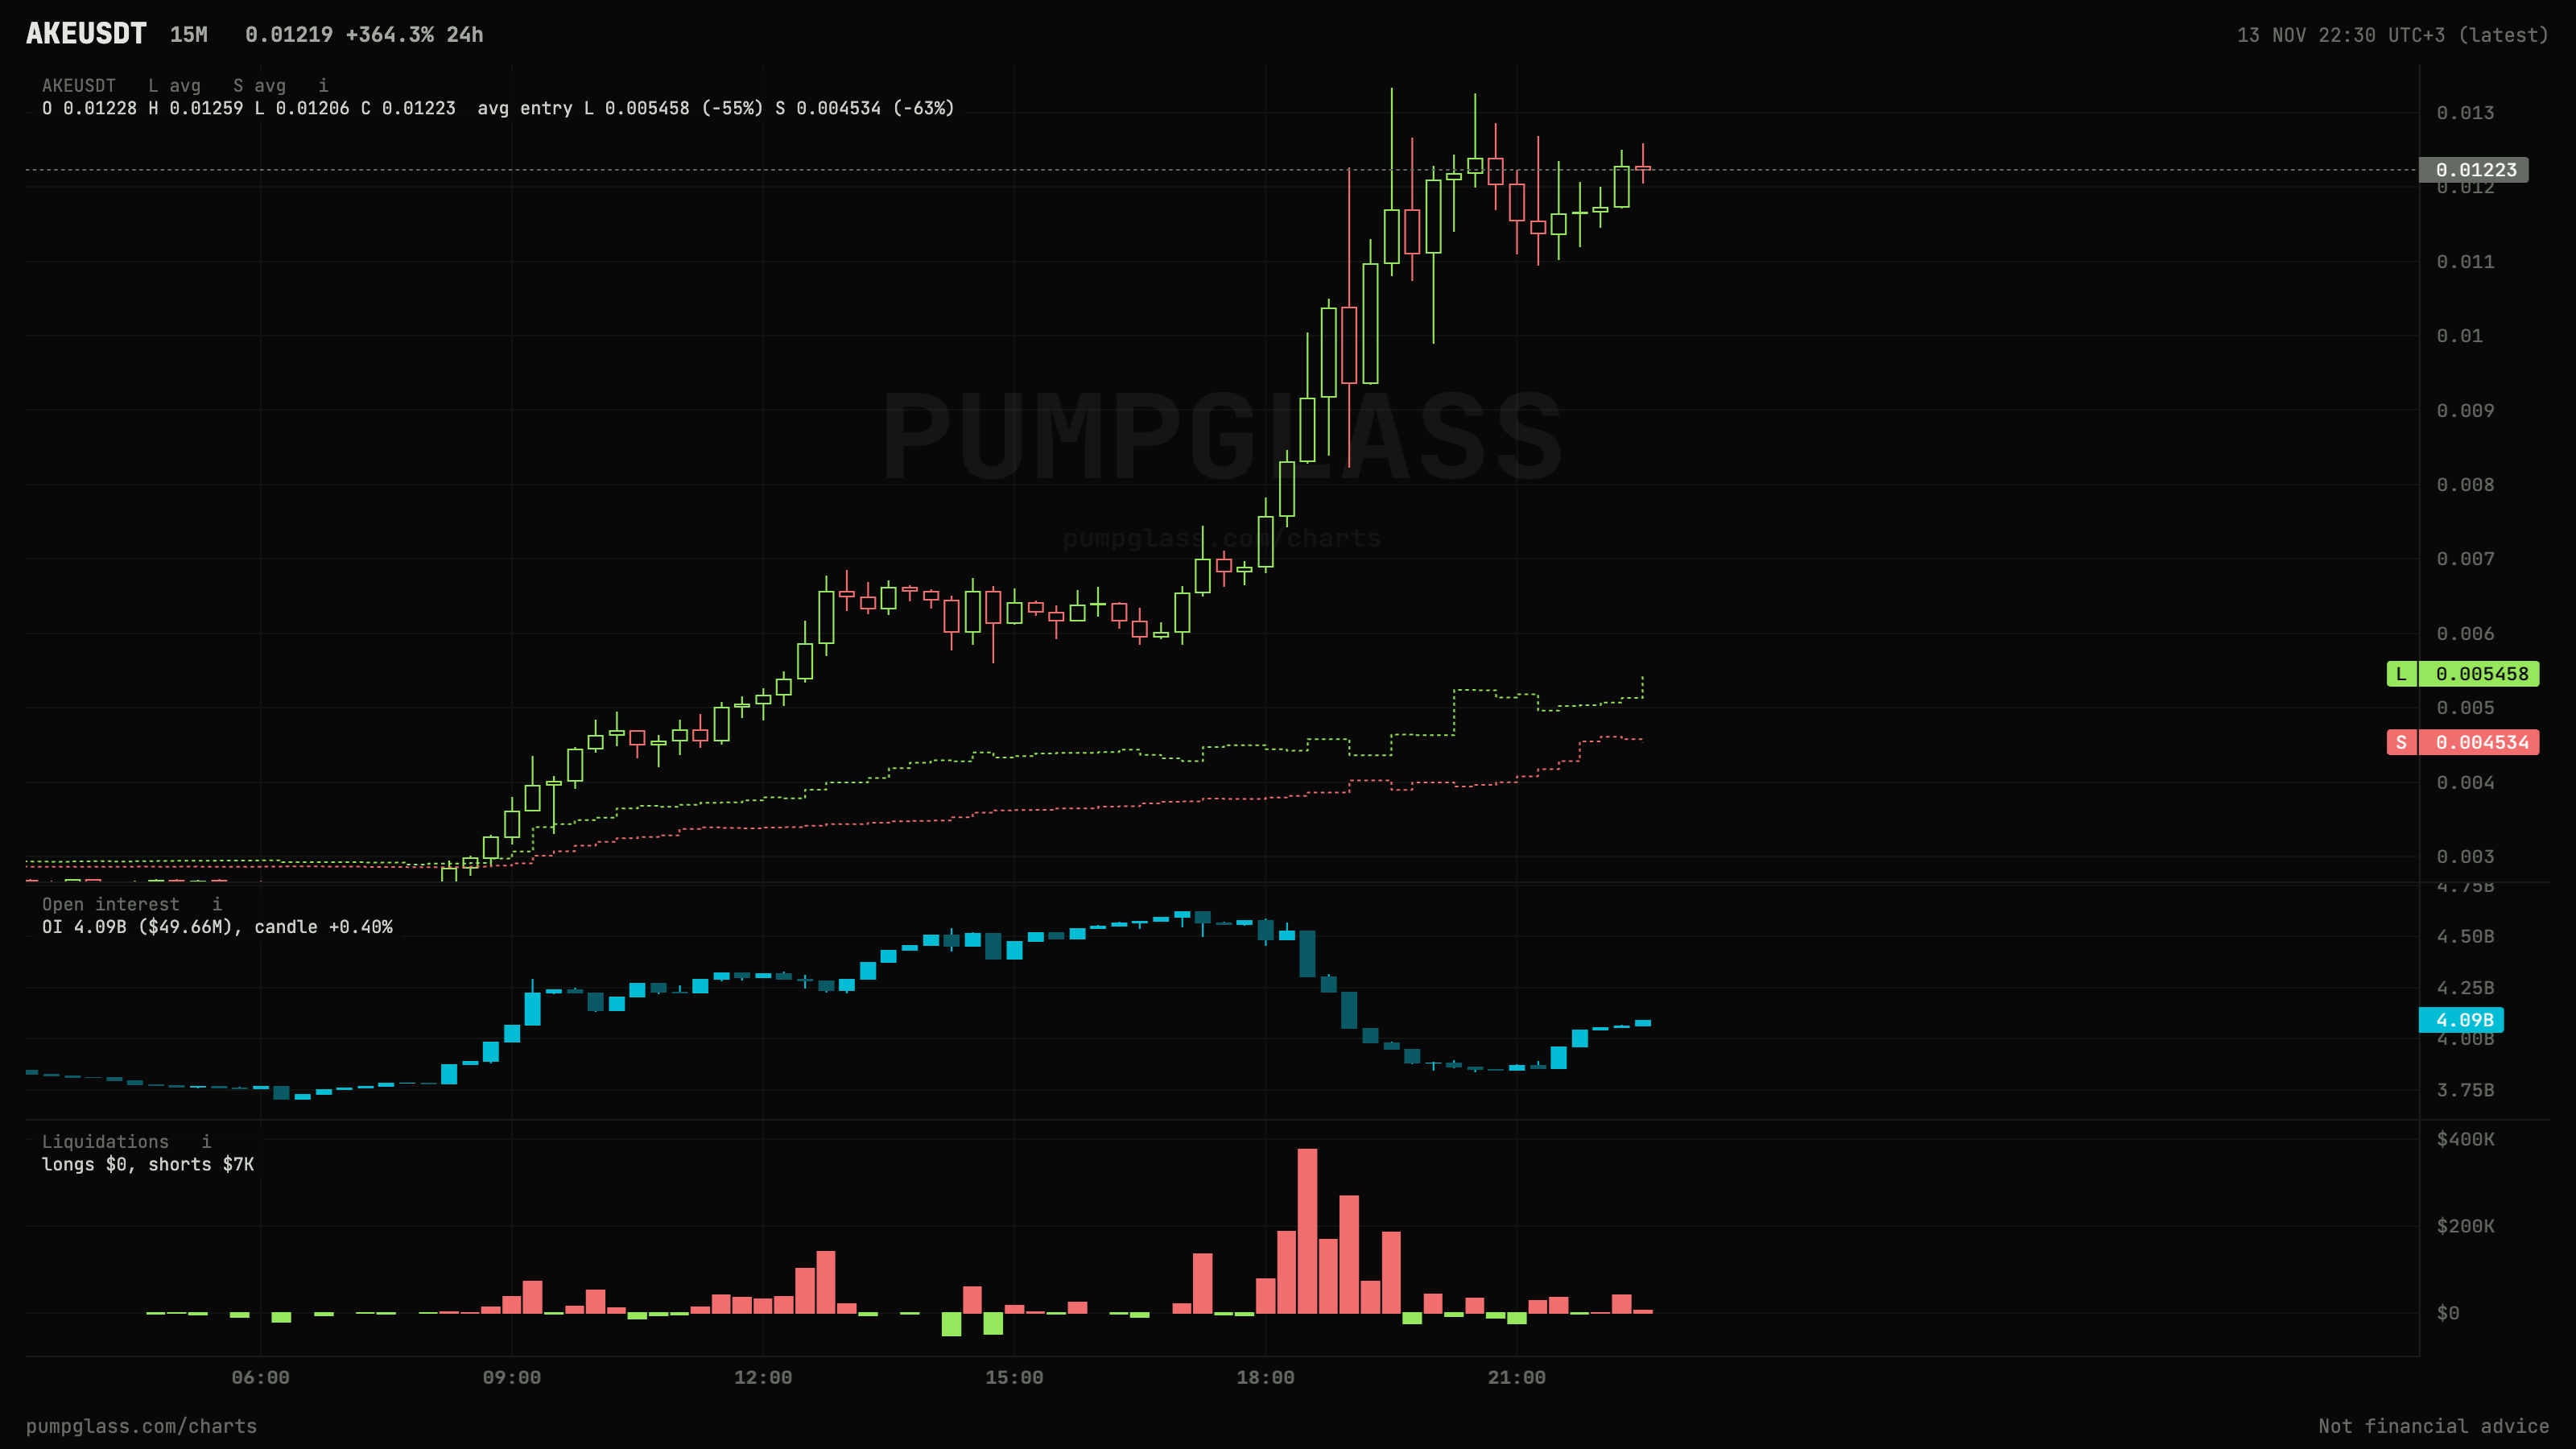
- Morning. The price rises and OI rises with it. New positions are opened into the rise.
- Evening. The price almost doubles, but OI falls, and the biggest short liquidations of the day appear at the bottom. The move was made by shorts being closed.
- After the top. Liquidations stop and OI grows again. New positions come back into the market.
The point: open interest together with liquidations shows what a move stands on. New money, or other traders' positions being closed.
5 situations where OI helps in a trade
1. A rise made by closing positions
The price jumps while open interest falls. The move was made not by new buyers but by shorts being closed, by hand or by liquidation. Like the evening on the AKE chart.
What to watch next:
- OI grows again on a pullback or in a range after the squeeze: new money came in.
- OI stays flat or keeps falling: the shorts are gone and no new positions arrive.
To check, turn on the liquidations layer on the chart. If short liquidations show up during the rise, they made the move. If there are none, shorts were closing by hand.
2. Leverage building up in a range
The price stays in a tight range for days while open interest grows. Both sides keep adding positions and wait to see who is right.
The longer leverage builds up, the more positions get liquidated when the price leaves the range, and all on one side at once. Open the liquidation map for that coin: it shows where the liquidations of longs and shorts built in the range sit. It does not tell you where the price will go, but it shows where the fuel for a sharp move lies.
3. A leverage flush
One or a few long candles, open interest drops 5-10% or more in a short time, and tall liquidation bars appear at the bottom. These are mass liquidations and closes.
After a flush there is less leverage in the market. Many traders wait for the moment OI stops falling and starts to recover: the market has been cleaned out and is adding positions again. On the AKE chart, this is the time after the top.
4. An unusual build-up in one coin
The market is calm, but one coin's open interest has grown several times in a day, and on several exchanges at once. This is not a glitch on one exchange: the whole market has turned to this coin.
Open such coins first: new leverage went there. Then check whether it was built into a rise or a fall, and the funding rate: if longs pay a lot, positioning leans long.
Compare with the coin's own normal. +10% OI in a day is a lot for BTC. For a small coin it is an ordinary day.
5. Where positions were opened, by price
A normal OI chart shows how many positions are open. It does not show at which price they were opened. That is the key part: when many positions are opened at one price, many traders share the same entry.
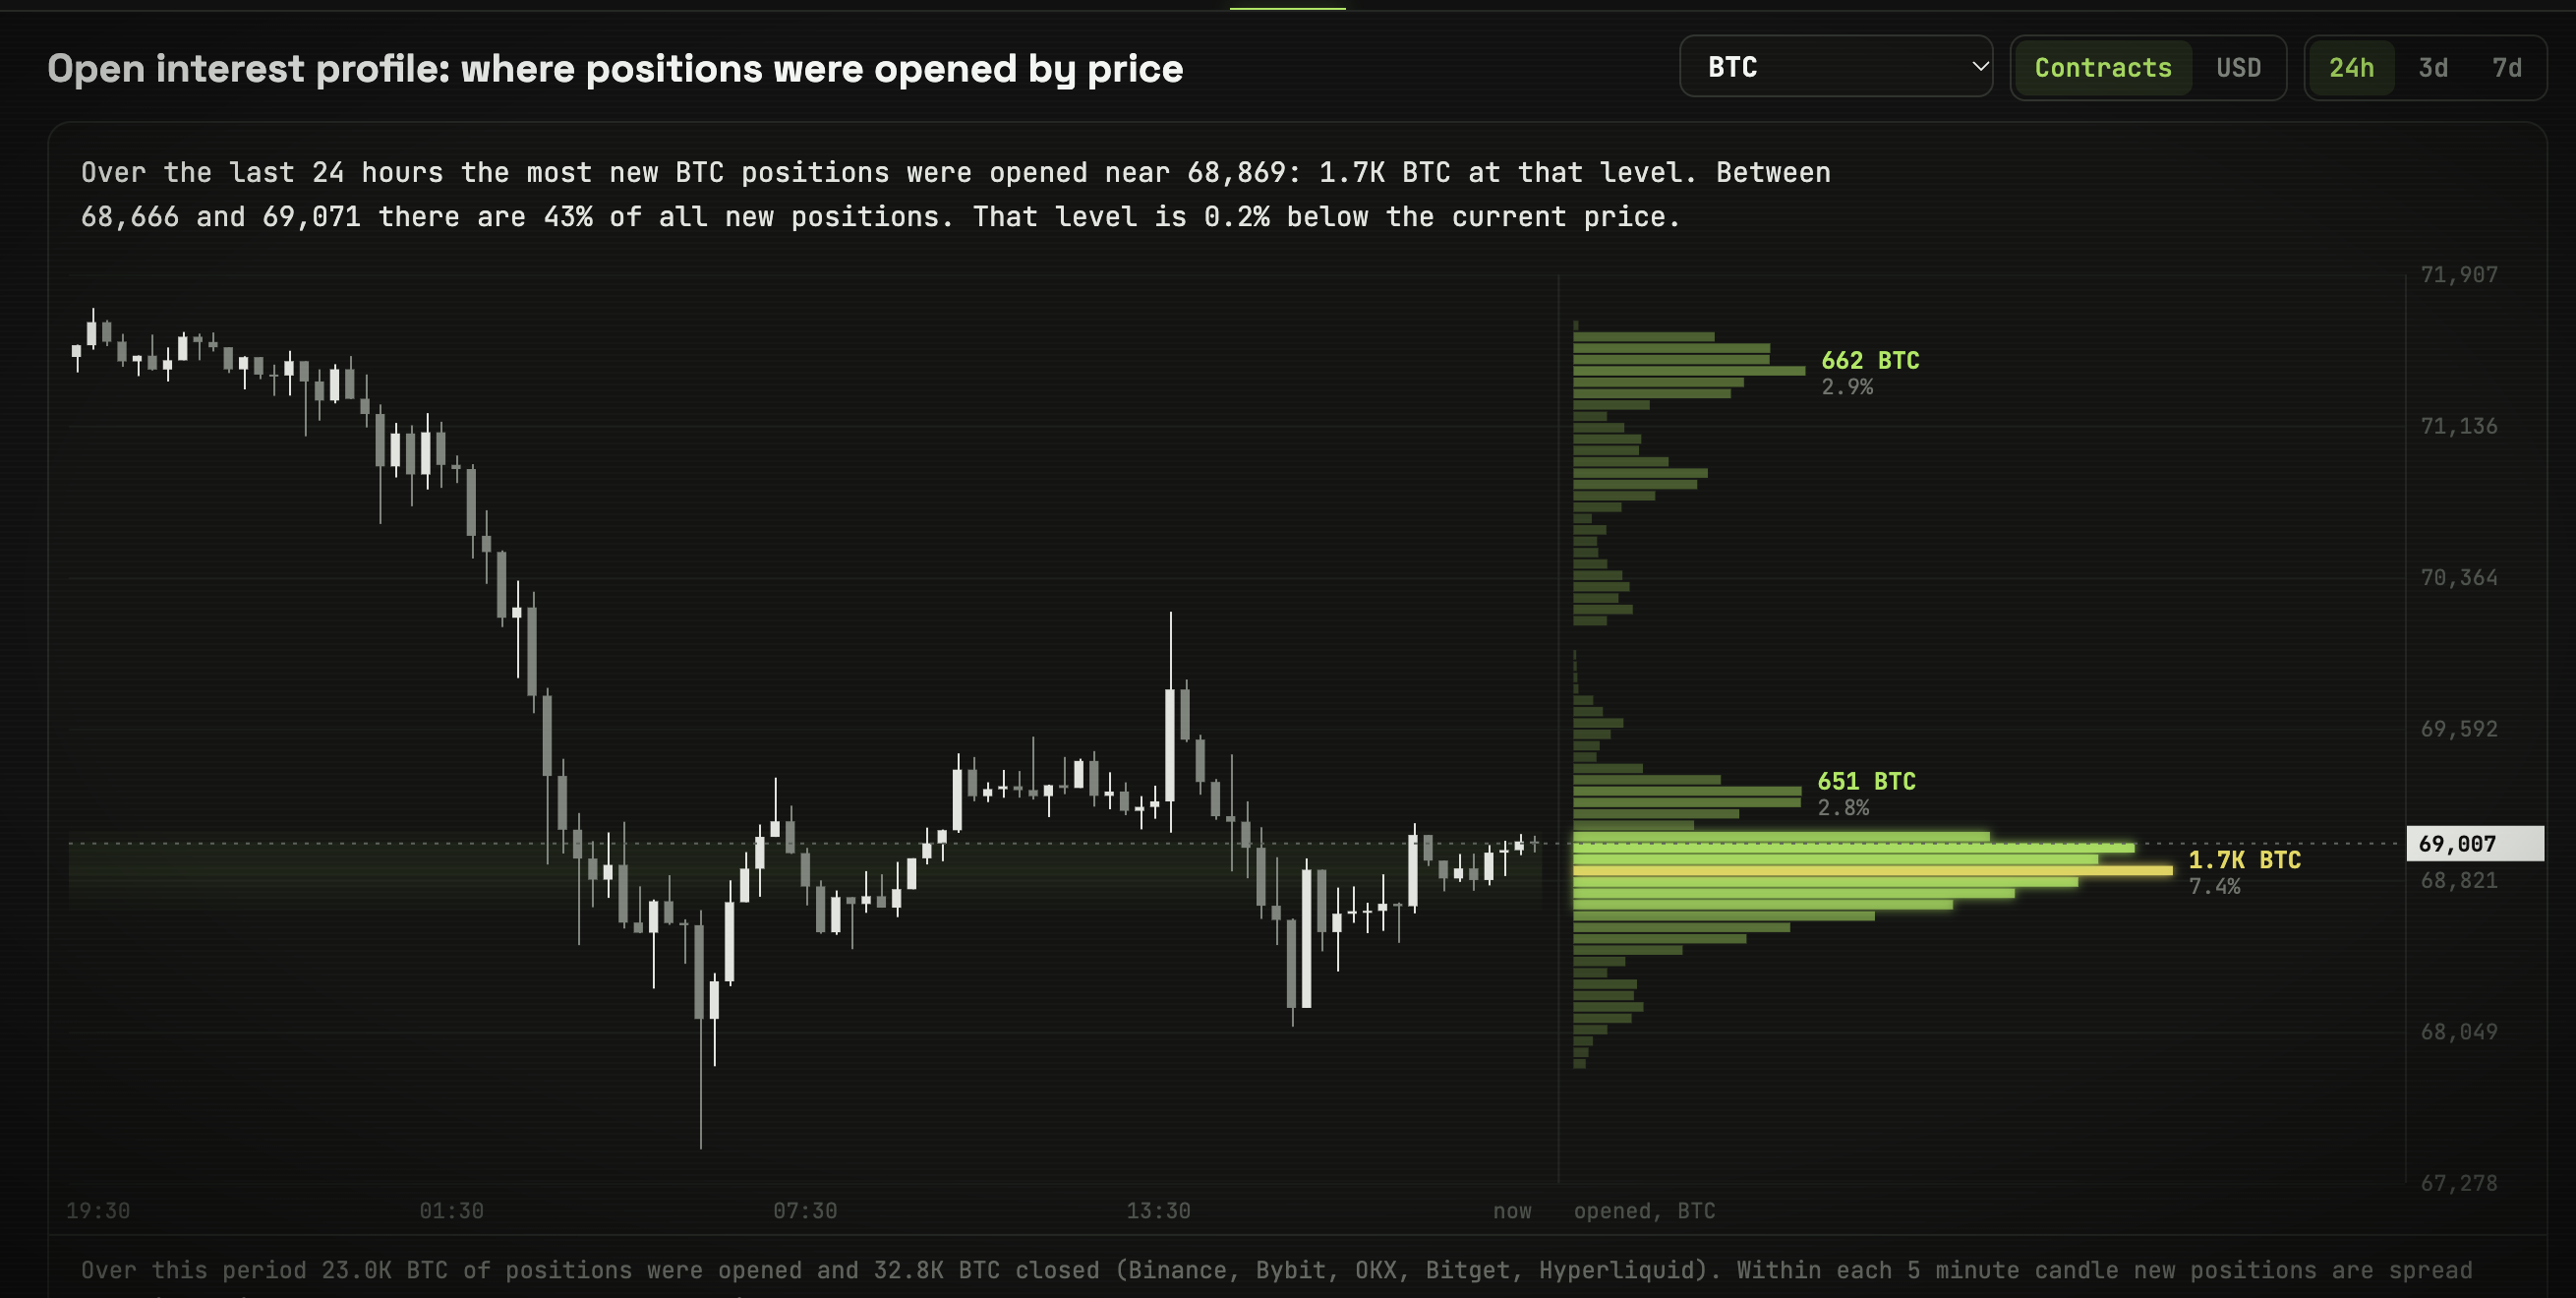
How to read it, using BTC over one day:
- The price fell from about 71,900 to 68,000 and bounced to 69,000.
- Over the day 23.0K BTC of positions were opened and 32.8K BTC were closed. More was closed than opened: the fall was driven mostly by closes.
- Almost no new positions were opened at higher prices. Most of the build-up came at the very bottom, in a narrow zone of 68,666-69,071: 43% of all new positions of the day. The largest level is 68,869 with 1.7K BTC, just 0.2% from the current price.
Why it matters. Almost half of the day's new leverage sits in one narrow zone right at the current price. These traders share one entry. If the price moves far out of the zone in either direction, part of these positions go into loss, and their stops and liquidations sit further along the move. That is why the price reaction at such a zone, and a break out of it, matters more than a random level on the chart.
OI together with funding and the long short ratio
Open interest tells you how much leverage is in the market. Two other numbers tell you who holds it:
- Funding rate. Strongly positive: longs pay shorts, there are more longs than the market wants to carry. Strongly negative: positioning leans short.
- The long short ratio of the crowd and of large traders.
The most stretched picture: OI rising, funding strongly on one side, the crowd on the same side. Lots of leverage, all on one side. These are the positions that get liquidated first.
How to use the PumpGlass open interest heatmap
- Open the open interest heatmap. Each bubble is a coin. Size: how much money went into new positions or left closed ones. Colour: green, OI grew; red, OI fell.
- Pick a period: 1 hour, 4 hours, 24 hours or 7 days. Exchanges are summed: Binance, Bybit, OKX, Bitget, Hyperliquid, and any of them can be turned off.
- The Contracts / USD switch: contracts show real new positions, USD shows the change in OI value including the price move.
- Point at a bubble: OI change in contracts and in dollars, the price change and a short note on what the combination means.
- Click a bubble. The coin profile opens below: candles, and on the right, at which prices positions were opened. The three largest levels are labelled, with a short summary on top.
Any coin can be found with the search above the map. Everything is free and needs no sign-up, the data updates every 5 minutes.
Open interest on a coin chart
The map shows the whole market at once. To read one coin candle by candle, open its chart and turn on the Open interest layer. OI there is also in contracts, so a price move does not draw it.
What to look for on the chart:
- A rise on new positions: candles and the OI line go up together.
- A rise on closes: candles up, OI down. Turn on liquidations and check for short liquidations during the rise.
- Leverage in a range: the price stays in a tight range, OI creeps up for days.
- A flush: a long candle, OI drops sharply and tall liquidation bars appear at the same time.
- Money coming back after a flush: OI stops falling and grows again.
You can also turn on funding and CVD on the same chart. Together with OI they show who is adding positions and who is paying for it.
Common mistakes
- Watching OI in dollars. A price rise draws an OI rise without a single new position.
- Watching one exchange. Positions move between exchanges. The sum of several exchanges is more honest.
- Thinking rising OI means rising price. Every new long has a new short. Price shows the direction; funding and liquidations show who is overloaded.
- Comparing percentages across coins. Each coin has its own normal.
- Waiting for an entry signal from OI. Open interest does not predict price. It shows where the leverage is and what drove the move.
FAQ
What is open interest in simple words?
The number of futures contracts that are open right now. It rises when new positions are opened and falls when they are closed.
Is high open interest good or bad?
Neither. High OI means there is a lot of leverage in the market. That makes sharp moves more likely in both directions, because more positions can be liquidated.
What is the difference between open interest and volume?
Volume counts trades over a period. OI counts positions that are still open. High volume with flat OI means positions just changed hands.
Why does OI fall when the price rises?
Positions are being closed into the rise. Most often these are shorts: some close by hand, some get liquidated. You can see it in short liquidations during the rise. Sometimes longs take profit.
Where can I see open interest for all coins for free?
On the PumpGlass open interest heatmap: 700+ futures, 5 exchanges, the change in contracts and in dollars, and the profile by price. For one coin, use the chart with the Open interest layer.
PumpGlass shows market data. It is not financial advice.