Q liquidation heatmap, liquidation map and liquidity heatmap

QUSDT - 12H24H 3D7D
loading

How to read the map

  • Bright bands. Brighter means more size at that price.
    Liquidations: where many leveraged positions would be liquidated if price gets there. These are estimates. A level disappears once a candle wick trades through it.
    Order book: real limit orders, sell orders above the price, buy orders below. The longer they stay, the brighter the band. Orders can be moved or cancelled.
  • Now column. The bars on the right are the same layer at this moment, level by level. A longer bar means more size at that price; the brightest bars are the levels that stand out.
  • $965KTags on the price scale. The biggest levels with their size in dollars. A dotted line runs from each across the chart.
  • Dollar scale. Above the map on the right: how many dollars sit in one 0.25% level for the dimmest colour and for the brightest. It follows the contrast slider.
  • Dashed lines. Average entry prices of whales: blue for longs, red for shorts, from Binance data. Turn them off with the Whales button.
  • Candles. The price. On narrow screens the price is a white line.
  • Updates by itself. The price in the header is live from Binance; the map, the order book and the whale lines refresh every minute. No need to reload the page.
>Explore more tools

Q liquidation map and order book

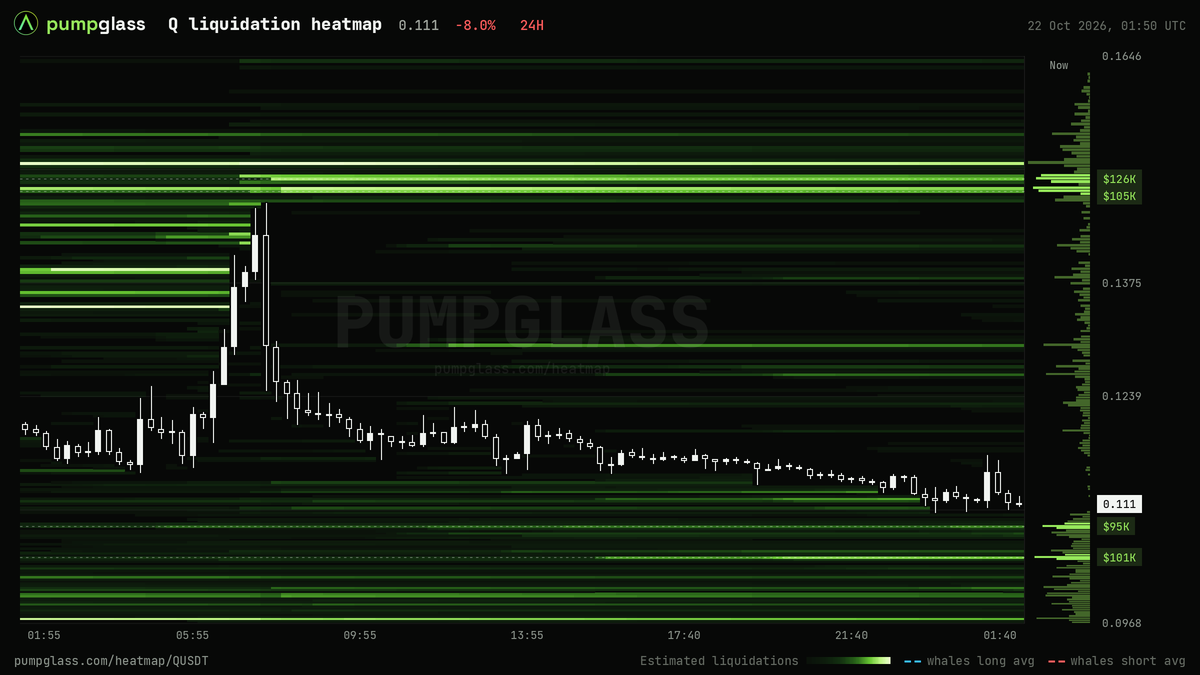
The Q liquidation heatmap estimates where leveraged positions on Binance futures would be closed out. Within 15% of the price $0.112 it shows about $47K below and $263K above. The largest clusters: $0.0919 (-18.3%, $72K), $0.0894 (-20.5%, $68K), $0.133 (+18.0%, $160K), $0.136 (+21.3%, $96K).

The Q order book heatmap shows real limit orders on Binance futures, summed in 0.25% steps. Walls that stand out right now: $0.103 (-8.3%, $74K), 5.1x the book around it; $0.0969 (-13.9%, $69K), 3.8x the book around it; $0.125 (+11.1%, $55K), 3.4x the book around it; $0.115 (+2.3%, $39K), 3.4x the book around it.

Whales on Binance futures hold Q longs at an average entry of $0.0667 and shorts at an average entry of $0.0714.

The map shows where size sits, not where the price will go. It updates every minute.

Q liquidation heatmap, liquidation map and liquidity heatmap, 24h
Q liquidation heatmap, liquidation map and liquidity heatmap, 24h, 2026-10-22 01:50 UTC
Q chart: open interest and CVDQ whale positionsWhy crypto is down or up today

Popular heatmaps

Crypto:BTCETHIRYSZECSOL1000PEPENEARXRPHYPEBIRBBNBBTWENAAKEDOGEWLDAGTMAGMAJCTSUIBTRPUMPUNIADAPAXGGTCAVAXDOTTAOFIL
Commodities:XAUCLXAGBZNATGASCOPPERXPTXPD
Stocks and indices:SOXLSNDKSKHYNIXKORUSPCXSNXXMUSOXSSKHYSPYMSTRCRCLSAMSUNGNVDATSLADRAMQQQINTCTQQQUNITREE