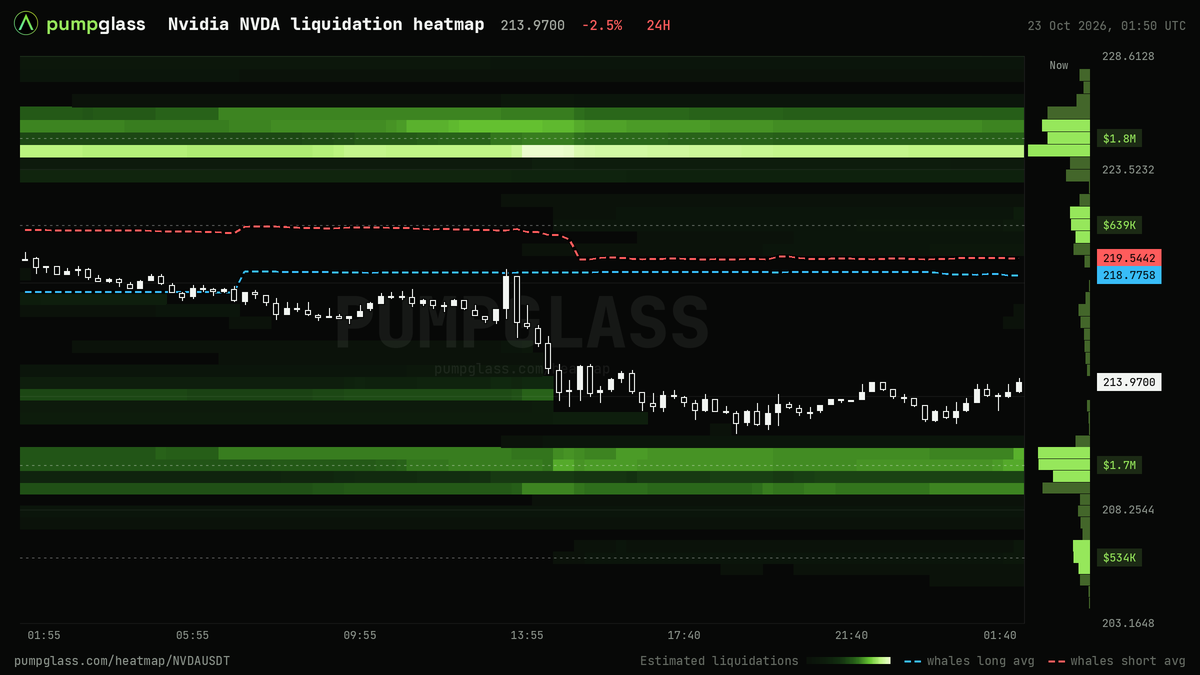
Nvidia NVDA liquidation heatmap, liquidation map and liquidity heatmap
-12H24H3D7D
loading
How to read the map
Bright bands. Brighter means more size at that price. Liquidations: where many leveraged positions would be liquidated if price gets there. These are estimates. A level disappears once a candle wick trades through it. Order book: real limit orders, sell orders above the price, buy orders below. The longer they stay, the brighter the band. Orders can be moved or cancelled.
Now column. The bars on the right are the same layer at this moment, level by level. A longer bar means more size at that price; the brightest bars are the levels that stand out. In All exchanges mode each bar is split by exchange colour.
$965KTags on the price scale. The biggest levels with their size in dollars. A dotted line runs from each across the chart.
Dollar scale. Above the map on the right: how many dollars sit in one 0.25% level for the dimmest colour and for the brightest. It follows the contrast slider.
Dashed lines. Average entry prices of whales: blue for longs, red for shorts, from Binance data. Turn them off with the Whales button.
Candles. The price. On narrow screens the price is a white line.
Updates by itself. The price in the header is live from Binance; the map, the order book and the whale lines refresh every minute. No need to reload the page.
>Explore more tools
NVDA liquidation map and order book
The NVDA liquidation heatmap estimates where leveraged positions on Binance futures would be closed out. Within 15% of the price $161.20 it shows about $88.7M below and $100.2M above. The largest clusters: $147.12 (-8.7%, $11.9M), $145.66 (-9.6%, $10.8M), $175.66 (+9.0%, $16.7M), $177.87 (+10.3%, $13.4M).
The NVDA order book heatmap shows real limit orders, summed in 0.25% steps. Walls that stand out right now: $155.04 (-3.8%, $5.5M), 7.7x the book around it; $150.09 (-6.9%, $4.7M), 5.5x the book around it; $174.78 (+8.4%, $3.2M), 6.1x the book around it; $177.87 (+10.3%, $2.3M), 4.3x the book around it.
Exchanges on the NVDA map: Binance, Bybit, OKX, Bitget. Liquidations are estimated from each exchange's open interest, the order book layer shows their real limit orders where the book is deep enough, and All exchanges adds them up. Whale entries refer to Binance futures.
Whales on Binance futures hold NVDA longs at an average entry of $164.80 and shorts at an average entry of $168.35.
The map shows where size sits, not where the price will go. It updates every minute.
Nvidia NVDA whales vs the crowd right now
Whales on Binance: 35% of their position value is long. Trader accounts (the crowd): 88% long, a gap of 53 points. Average long entry: $164.80 (+2.2% from the price). Average short entry: $168.35 (+4.4% from the price). Open longs are at a loss of $1.5M, open shorts are in profit by $5.6M.
Funding now: +0.0375%, paid every 8 hours.
NVDAUSDT trades on Binance 24/7, including weekends and holidays. The stock exchange where the shares trade is closed on weekends and outside its trading hours. When the underlying market is closed, the order book is usually thinner, so liquidation clusters near the price matter more.
Next scheduled US releases: US PCE inflation / US GDP Nov 25, 2026; US jobs report (Non-Farm Payrolls) Dec 04, 2026.
Are whales long or short on Nvidia NVDA right now?
Whales on Binance: 35% of their position value is long. Trader accounts (the crowd): 88% long, a gap of 53 points. Average long entry: $164.80 (+2.2% from the price). Average short entry: $168.35 (+4.4% from the price). Open longs are at a loss of $1.5M, open shorts are in profit by $5.6M.
Does NVDAUSDT trade on weekends?
Yes. NVDAUSDT trades on Binance 24/7, including weekends and holidays. The stock exchange where the shares trade is closed on weekends and outside its trading hours. Funding is paid every 8 hours.
Updated 2026-11-14 00:00 UTC
NVDA key levels right now
Level
Price
From price
Size
Largest long liquidation cluster below
$147.12
-8.7%
$11.9M
Largest short liquidation cluster above
$175.66
+9.0%
$16.7M
Largest bid wall in the order book
$155.04
-3.8%
$5.5M, 7.7x the book nearby
Largest ask wall in the order book
$174.78
+8.4%
$3.2M, 6.1x the book nearby
Whale average long entry
$164.80
+2.2%
Whale average short entry
$168.35
+4.4%
NVDA large orders and order book walls
Large resting orders, often called whale orders, on Binance, Bybit, OKX: real limit orders summed in 0.25% steps, 0.5% to 20% from the price. A level 3x larger than the book around it is a wall. Data as of 2026-11-14 00:00 UTC.
Side
Price
From price
Size
vs nearby
Exchanges
Held for
Buy
$155.04
-3.8%
$5.5M
7.7x
Binance 73%, OKX 23%
9 h
Buy
$150.09
-6.9%
$4.7M
5.5x
Binance 76%, OKX 18%, Bybit 6%
9 h
Buy
$158.17
-1.9%
$4.0M
3.4x
Binance 77%, OKX 19%
40 min
Sell
$174.78
+8.4%
$3.2M
6.1x
Binance
8 h
Buy
$144.93
-10.1%
$2.7M
4.8x
Binance 59%, OKX 30%, Bybit 11%
8 h
Buy
$160.16
-0.6%
$2.7M
2.3x
Binance 70%, Bybit 17%, OKX 13%
2 h
Buy
$139.96
-13.2%
$2.6M
5.1x
Binance 78%, OKX 19%
8 h
Sell
$177.87
+10.3%
$2.3M
4.3x
Binance 90%, OKX 7%
8 h
NVDA walls pulled as the price came close (24h)
Walls that disappeared when the price came within 1% without trading through them.
Time (UTC)
Side
Price
Size before
Closest price
11-13 19:00
Buy
$157.78
$5.0M
0.6%
11-13 21:45
Buy
$160.16
$3.7M
0.8%
NVDA estimated liquidations if the price moves
Move
Down: longs liquidated
Up: shorts liquidated
±1%
$1.2M
$119K
±3%
$16.0M
$13.2M
±5%
$25.9M
$27.2M
±10%
$62.4M
$59.4M
Running total from the current price $161.20, by the liquidation model.
NVDA liquidation heatmap: questions
Where are the biggest NVDA liquidation levels?
Below the price, the largest cluster is at $147.12 (-8.7%), about $11.9M of long positions. Above the price, the largest cluster is at $175.66 (+9.0%), about $16.7M of short positions.
How much NVDA would be liquidated if the price falls 5%?
By the model, about $25.9M of long positions sit between the current price and 5% below it. A 5% rise would reach about $27.2M of shorts.
Where is the largest NVDA order book wall?
The largest bid wall is at $155.04 (-3.8%), $5.5M, 7.7 times the book nearby. The largest ask wall is at $174.78 (+8.4%), $3.2M, 6.1 times the book nearby. The next largest order levels: $4.7M at $150.09 (-6.9%); $4.0M at $158.17 (-1.9%).
Were any large NVDA orders pulled in the last 24 hours?
Yes, 2 in the last 24 hours. The largest: Buy, $5.0M at $157.78, pulled when the price was 0.6% away.
At what price are whales positioned in NVDA?
The biggest Binance traders hold longs at an average entry of $164.80 (+2.2% from the current price). They hold shorts at an average entry of $168.35 (+4.4% from the current price).
How often is the NVDA map updated and what does it show?
The liquidation map and the order book update every minute. Liquidation levels are an estimate built from open interest and typical leverage, not a list of real orders, and they do not show where the price will go. The order book layer shows real Binance limit orders.
Nvidia NVDA liquidation heatmap, liquidation map and liquidity heatmap, 24h, 2026-11-13 01:50 UTC
Which exchanges does the NVDA liquidation heatmap include?
Binance, Bybit, OKX, Bitget. All exchanges is the default view; the switch above the map shows one exchange at a time.